Posted on Leave a comment

Managing Stakeholders in Agile Projects

Managing Stakeholders in Agile Projects can be tough in large or old organisations. Have you heard this: “YES. We are agile. But you must tell me what I will get and when!” It’s painful.

The natural tension between Agile and Senior Stakeholder Structures

Upper management in large organisations and Programme Management structures (e.g. PMO) have a natural conflict of interests (or ‘tension’) with agile principles – i.e.

  1. Management and PMO want details on what is going to be delivered and when – i.e. Definition Up Front! – and
  2. The Agile product delivery team want to adapt and change dates and features as & when the customer/audience change – i.e. Definition When it’s NEEDED!

Addressing the tension – how to run Agile in large Stakeholder structures

So – how should we approach the comms around an Agile Project / Programme, and stakeholder management?
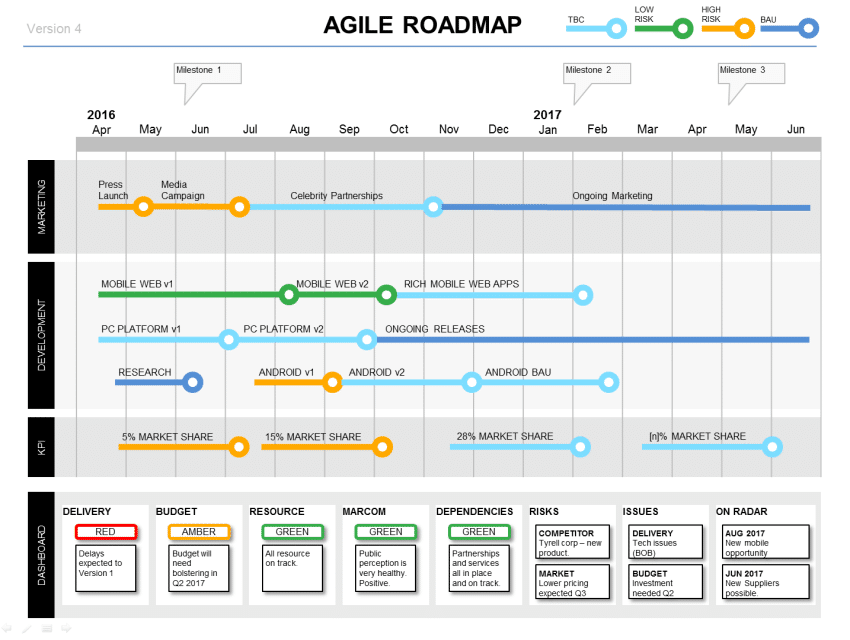
The Powerpoint Agile Roadmap Dashboard slide shows project status + Roadmap

Clear “Release” / “Goal” Planning

  1. Describe your Releases (i.e. the significant product drops / deliveries) clearly
  2. Provide a clear 1-sider about each release, outlining what the business goals are

Manage expectations with “The Cone of Uncertainty”

  1. For each aspect of the release, clearly define the expected variance of estimates, according to degree of certainty
  2. So, if you have allowed e.g. 2 sprints / iterations for a feature, but do not plan to unpack the user stories until later on, assign an appropriate +/- 40% caveat to the estimation
  3. For more info
    1. see Agile 101’s understanding the cone of uncertainty.
    2. or Wikipedia’s entry on Cone of Uncertainty.

Focus on Epic User Stories / High-level Features

i.e. use High Level Requirements (EPICS / Features / Themes) to define the delivery

  1. Do not break down your Epics / Features into user stories unless:-
    1. They are about to go into iteration, or
    2. They are very high risk or unknown, and you can’t attach any estimation.
  2. So – avoid breaking down the WHOLE delivery into User Stories.
    1. It is in direct conflict with Agile and Lean to invest in definition unless you NEED to.
    2. So – only spend the teams’ time on defining user stories at the point of implementation.
  3. Keep these high level requirements flexible – this gives you agile wiggle room and scope flexibility at the point of implementation.
  4. Estimate the Epics in Story Points or T-Shirt sizes.
    1. See estimation recommendations here from Agile 101.

Keep Progress Clear

  1. Update your stakeholders regularly on where you are with Features / Epics implementation.
  2. Use a simple format (e.g. Release Plan) to explain which workstreams are delivering which features, and when.
Excel RAID Log & Dashboard Template

Run a High-Level RAID Log and reference your Epics

  1. Use a RAID log to speak in Senior Stakeholder ‘lingo’.
  2. Keep this light, and do not go into too much detail.
  3. Update each sprint, or as serious RAID changes emerge.

Leave room to manoeuvre within your Epics

  1. When defining your high level features or “Epics”, keep the scoping high-level.
  2. Be clear and strategic about the scenarios and success criteria.
  3. Assign risk information to your Epics – raise stakeholder awareness of which features are risky / giving issues.
    1. This will enable them to help you prioritise.
    2. In healthy organisations, this provides a diologue in which to descope and reprioritise high level features.

Include High Level “Non Functional Requirements” (NFR s)

  1. Be sure to include any significant NFRs.
  2. e.g. (and not limited to-) :
    1. Ingegration requirements.
    2. Load testing, User testing, Stakeholder Acceptance testing requirements.
    3. Performance testing.
    4. contingency for all of the above.

Communicate Agile Plans to Senior Stakeholders

Here are some reporting formats that you can use to communicate Agile plans to Senior Stakeholders:

Posted on Leave a comment

Status Report

The Status Report is an important Project and Programme -level reporting tool – it should give all the important high-level project information on 1 page.

Status Report Dashboard

This image shows a Status Dashboard Template slide, which can be found in the Status Template pack.

A Status Report Dashboard may literally show some dashboard dials (as this figure shows), or may just be displaying key information, like a conventional dashboard.

The key similarity with a Dashboard is that you can get vital information AT A GLANCE – i.e. ON ONE SIDE.

Status Report Formats

  1. Dashboards
  2. Dashboard Dials
  3. Charts
  4. Agile Burndown
  5. Highlights
  6. RAG – Red Amber Green
  7. RAID
  8. SWOT
  9. Next Steps

Status Report Dials

Some status reports use the “Dial” format (i.e. just like a car dashboard speedometer dial).

Dial formats give a good sense of minimum, maximum, and where our “status” is in that spectrum. This is far better than just a numerical value.

Project Status Report Templates


Posted on

RAG Status – Show your Project Status!

“RAG Status” stands for R / A / G = Red, Amber or Green (it’s an acronym, which means Annoying Manager Word!)

RAG status is clearly communicated in this Dashboard template

It is commonly used in Project Status reporting to communicate the level of risk.

The Idiots Guide to RAG STATUS

  1. RED = High Risk
  2. AMBER = Medium Risk
  3. GREEN = Low Risk

The Typical RAG Status Conversation

Manager: “What is your RAG status, Mr Smithers?”

You: “I have GREEN for Project Sunshine, and AMBER for Project Saving Rear”

Good – you passed!

Need more help? Here are a few RAG Status Examples

Watch Out – RAG STATUS can mean different things !!

“Do I need to poke nose in and mess your life up??” Management RAG Status

  1. RED = Your manager MESSES UP YOUR PROJECT IMMEDIATELY.
  2. AMBER = Your manager HANGS AROUND ANNOYINGLY.
  3. GREEN = Your manager reverts to NORMAL PAIN IN THE REAR.

THE TRUTH: Project Manager’s RAG Status

This is what it really means.

  1. RED = My project is ABOUT TO GO BANG. I am PROTECTING MY ASS.
  2. AMBER = My project is ABOUT TO GO RED.
  3. GREEN = My project seems OK, so IT WILL BE AMBER OR RED NEXT WEEK.

MORE JARGON: “Issue Focussed RAG Status”

This will impress your managers. Use these exact words if you want to appear all business-like:

  1. RED = LIVE ISSUE: remedial action is required to bring the project back within budget or delivery schedule
  2. AMBER = ISSUE is being addressed: remedial action is in progress, and ISSUE is being addressed
  3. GREEN = NO LIVE ISSUE: no action required

Some more generalised Risk and Status communication formats

Summary – use RAG Status carefully!

RAG Status is a great tool for communicating status quickly, but beware : Make sure you define what the Red, Amber, and Green mean for you and your stakeholders!

Posted on Leave a comment

Project Status Report Template

Everybody needs a good Project Status Report Template. Here at Business Documents UK we provide a selection of Status Report templates that can be used for a variety of project purposes.

Powerpoint Project Status Report Templates

  1. Powerpoint Roadmap with dashboard – has a project status report area.
  2. Powerpoint Product Roadmap Template – has a project status update area.

Visio Project Status Report Templates

  1. Product Roadmap + Dashboard Template – has a project status report area.

More to come soon!

Posted on Leave a comment

Powerpoint Dashboard

This excellent value Powerpoint Dashboard includes Status, RAG, KPI, RAID, SWOT, and Highlights. Use this for any dashboard presentation.

The Powerpoint Dashboard Includes:

  1. Overall RAG
  2. KPI
  3. Workstream RAG
  4. RAID
  5. SWOT
  6. Highlights.

Use this template pack to communicate your Project or Product status to stakeholders of all levels.

More Dashboard Formats

Posted on Leave a comment

Project Dashboard

The Project Dashboard – the perfect way to deliver Project Status reports to stakeholders.

  1. Summary RAG
  2. KPI Status
  3. RAG by Project Area
  4. RAID – Risks, Assumptions, Issues, Dependencies

You can use this format as a form of regular project communication update.

Project Dashboard Formats

Outline the key Project Status points in minutes, on this Dashboard

Highlight the important messages of your Project

  1. Successes
  2. Upcoming releases
  3. Live risks
  4. Blockages
  5. Caveats

It also includes a Roadmap format to compliment the Dashboard.

This Product Roadmap shows Timeline, Workstreams and a Project Dashboard

Outline the Red, Amber, Green Project Statuses with this Dashboard

This Dashboard, part of a Product Roadmap Template, features these Dashboard status updates:-

  1. Delivery (with RAG – Red, Amber, Green)
  2. Budget (with RAG – Red, Amber, Green)
  3. Resource (with RAG – Red, Amber, Green)
  4. Marcom – Marketing and Communications (with RAG – Red, Amber, Green)
  5. Dependencies
  6. Risks
  7. Issues
  8. On Radar (‘heads up’ items)
This template features both the Product Roadmap, and the Project Dashboard

Reduce your Project Update Documentation down to 1 Document

  1. No need to send around an unfathomable Gantt – your stakeholders hate them!
  2. No need to pull out boring spreadsheets
  3. No need for piles of PDF attachments

Project Dashboard Templates