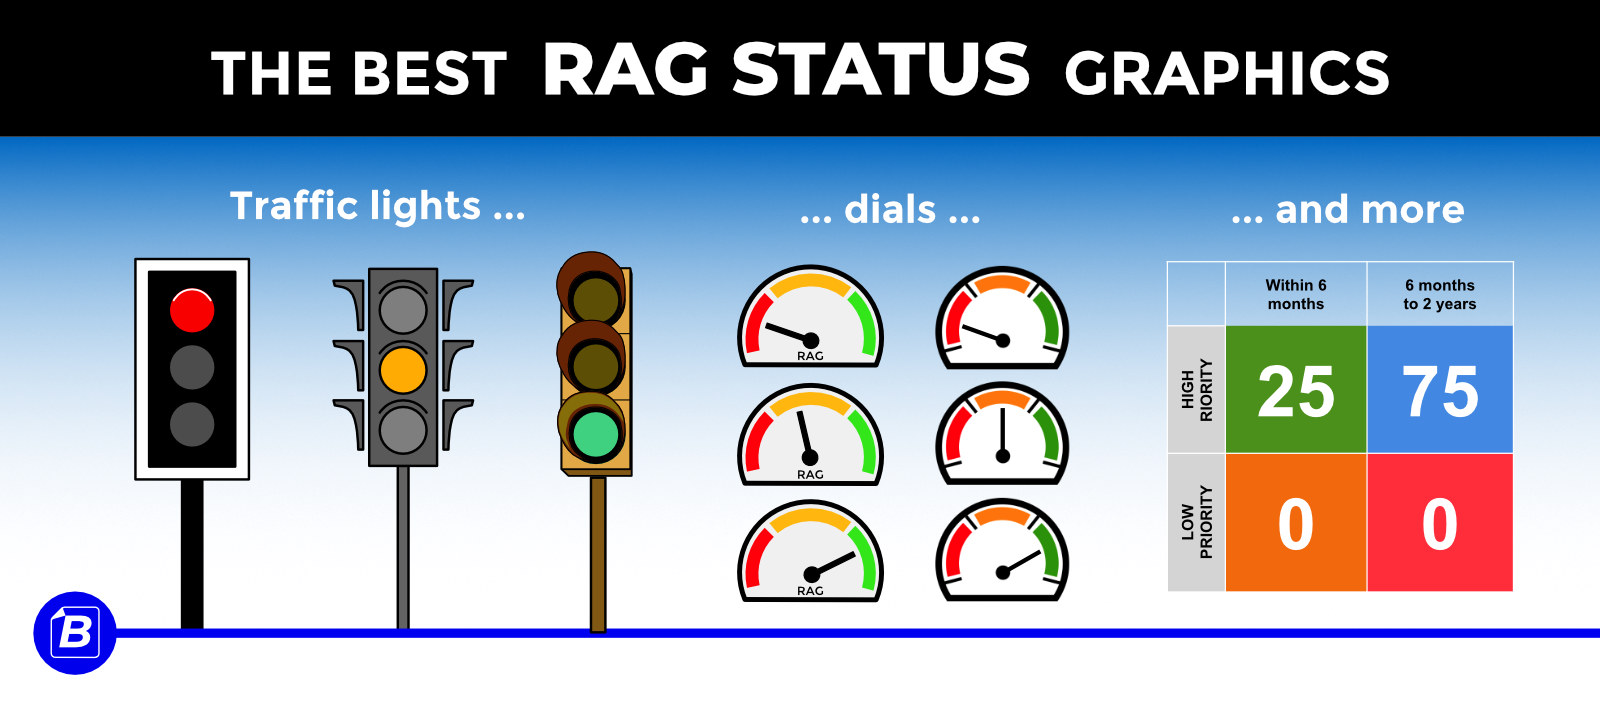
RAG Status – Red / Amber / Green – can be shown in a variety of formats. Which is the best RAG Status graphic?
Traffic lights are useful RAG graphics if you have just one or two statuses to report. If you want to show more, LED lights can be used. Dials are useful RAG status indicators if you want to show e.g. where in “Green” your green status currently is; i.e. Is it very green?.. or is it nearly amber?
You can use the Red Amber Green of traffic lights in different graphic styles: USA traffic lights, UK traffic lights, New York style traffic lights, or just a plain generic style.
UK and USA Traffic Light styles
Use these striking UK and USA styles to bring your presentation alive. Many people make the mistake of using simplistic graphics (three circles in a rectangle) which can be so boring!
Add spice to your presentation with authentic, clear graphics.
New York style traffic lights
Are you short on time?
Use these templates to help with this Best Practice:
RAG Status Template PowerPoint
The RAG Status Template provides a range of RAG formats so that you can communicate project risk levels – Red, Amber, Green – quickly and easily.
See: RAG Status Template PowerPointStatus Template Toolkit Discount Bundle
Used by professionals in over 100 countries. The Status Template Toolkit includes the best RAG Status, Business Dashboard, Reports and Status Update templates at a massive 73% discount.
See: Status Template Toolkit Discount BundlePowerpoint Project Dashboard with Status Template
This Powerpoint Project Dashboard with Status Template is easy to edit. Download it now! The dials & status graphics are simple to change.
See: Powerpoint Project Dashboard with Status TemplateBusiness Topics that support this Best Practice
Project Status Reporting
Project Report
A stylish PowerPoint project report which allows you to show your progress against the plan and budget.
See: Project ReportComparison Template
A stylish PowerPoint comparison template which lets you quickly and effectively show the difference between different companies or products.
See: Comparison TemplateRAG Status Template PowerPoint
The RAG Status Template provides a range of RAG formats so that you can communicate project risk levels – Red, Amber, Green – quickly and easily.
See: RAG Status Template PowerPointProject Handover PowerPoint
This captures the key elements of a project so you can deliver a smooth handover.
See: Project Handover PowerPointRAG Status Reports & Dashboards
RAG Status Template PowerPoint
The RAG Status Template provides a range of RAG formats so that you can communicate project risk levels – Red, Amber, Green – quickly and easily.
See: RAG Status Template PowerPointProject Status Report Template Discount Bundle (PPT & Excel)
All of our Project Status Report Template formats in one discount package. Enjoy our professional formats for delivery status, risk status, rollout status, and innovation status. All in easy-to-edit Powerpoint and Excel.
See: Project Status Report Template Discount Bundle (PPT & Excel)Solution-focused Excel Risk Log with Dashboard Template
This Risk Log template supports a Solution-focused Risk Management strategy by combining a powerful Risk Dashboard with Mitigation Data. Show HOW and WHEN your risks will be mitigated, and WHO owns them.
See: Solution-focused Excel Risk Log with Dashboard TemplateDashboard Report (Powerpoint)
A dashboard report powerpoint perfect for updating key stakeholders on projects against delivery, including overall summary, RAG, Risk, SWOT, Dials, Highlights and a Roadmap.
See: Dashboard Report (Powerpoint)