Agile Burn-Down and Burn-Up Template Excel
With this amazing tool you can create your burn-down and burn-up charts in minutes instead of hours. We’ve also saved you money by using Excel so that you don’t need to pay a monthly subscription fee – you can just use Google Sheets!
Burn-down Charts ready in minutes
Agile software is great for planning and tracking work, but it’s not so good for reporting. It’s hard to create a burn-down chart with Jira or other agile software.
This simple Excel template makes creating your burn-down charts easy. Just add the estimates and you’re done! No need to enter data in multiple places, no need to add lots of data in your Jira tickets – just use this template once per sprint and save time on every project you do from now on!
Track your progress against projections and monitor scope creep!
With this amazing tool, we can create our burn-up charts in minutes instead of hours, so that you can track and communicate changes in scope. We’ve also saved money by using Excel – a common software solution that most people already have. If you do not have Excel, you can simply use Google Sheets. Now you can spend more time working on projects than managing them!
Template Contents
- Data Sheet: Area for data entry and chart previews.
- Help Sheet: Outlines how to use the template, and the key concepts.
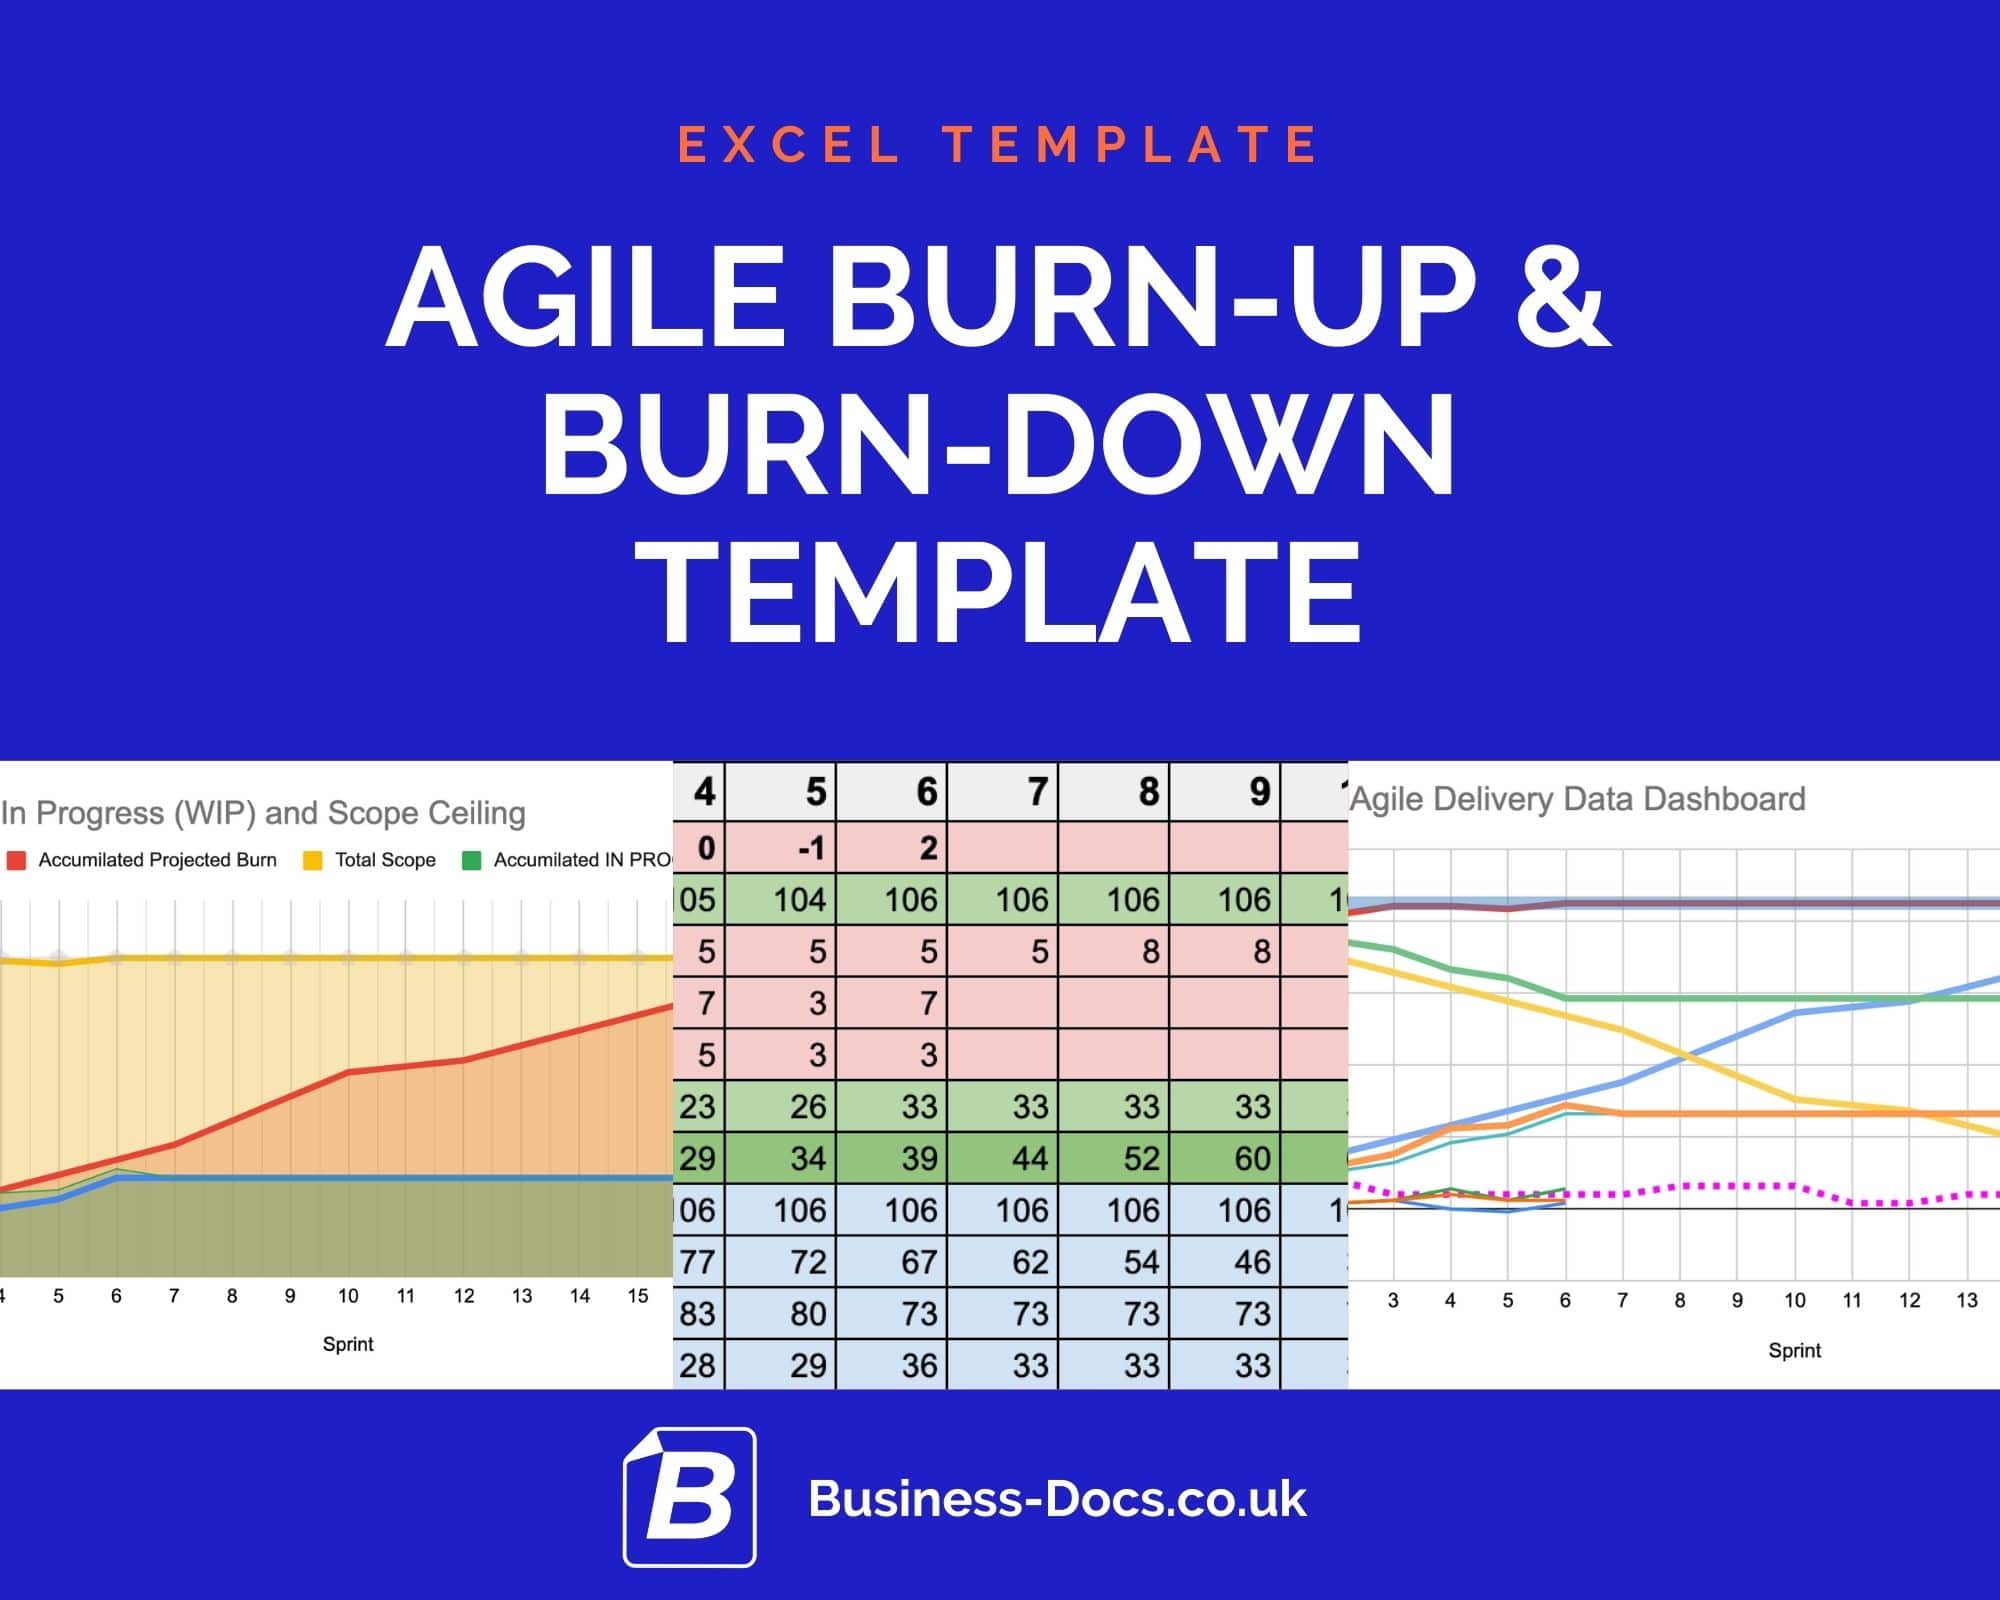
- Chart with All Data (screenshot below).
- Burn Down Chart (screenshot below).
- Burn-up Chart.
- Burn-up Chart with WIP.
- Burn-up Chart with Trend Line.
Previewing all data chart
So that you can see all the data in one chart, and check it for issues.
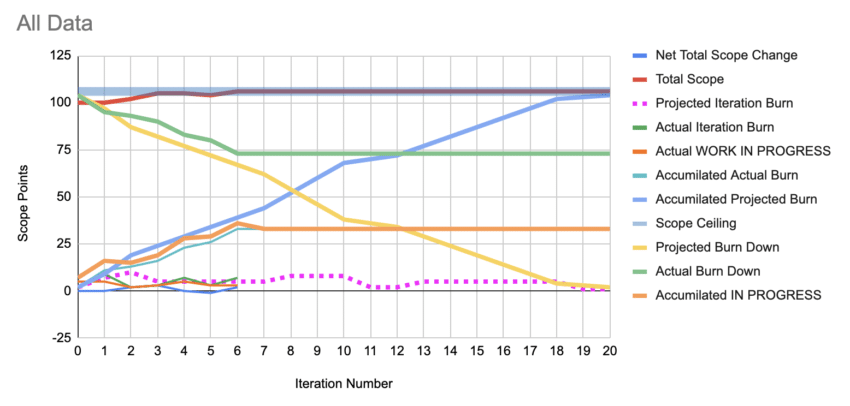
Burn-down Chart
This Product is included in these discount bundles:
-
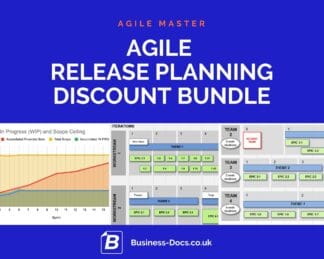
The Agile Release Planning Template Discount Bundle
$ 31.24 Add to cart -
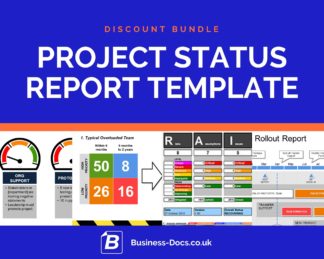
Project Status Report Template Discount Bundle (PPT & Excel)
$ 73.49 Add to cart -
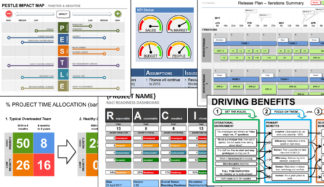
New Product Development (NPD) Startup Template Bundle – Powerpoint & Excel
$ 81.99 Add to cart -
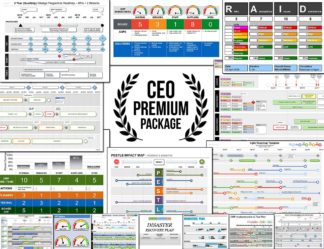
All Templates in 1 Package – The CEO Premium Discount Bundle
$ 522.00 Add to cart -
Powerpoint Project Schedule Template Discount Bundle
$ 81.99 Add to cart -
Agile Project Template Discount Bundle (PPT & Excel)
$ 63.97 Add to cart
The CEO Premium Bundle

All Templates in 1 Bundle – The CEO Premium Package
Get all of our professional templates in ONE PACKAGE. 100+ templates with over 70% discount, and a multi-user license.