This guide will walk you through the process of creating a risk dashboard for your project. We’ll discuss how to create metrics and what should be included on the dashboard.
The consultants here at Business Documents UK Ltd have been working on risk management, and the design of a Risk Dashboard, for more than 20 years.
As with any “Dashboard” format, the most important factor is that you can tell the right story, very quickly, to a broad audience. This requires focus and very clear presentation of information.
1 – Populate your Risk Log: Record your risks in a structured list. This is also called a “Risk Log”.
2 – Assign a Risk Score to each risk: Give each risk a score for severity – Extreme / High / Medium / Low – so that you can prioritize your attention.
3 – Allocate Risk Status to each risk: Assign a mitigation status – “Open / Improving / Closed” – so that the status is clear.
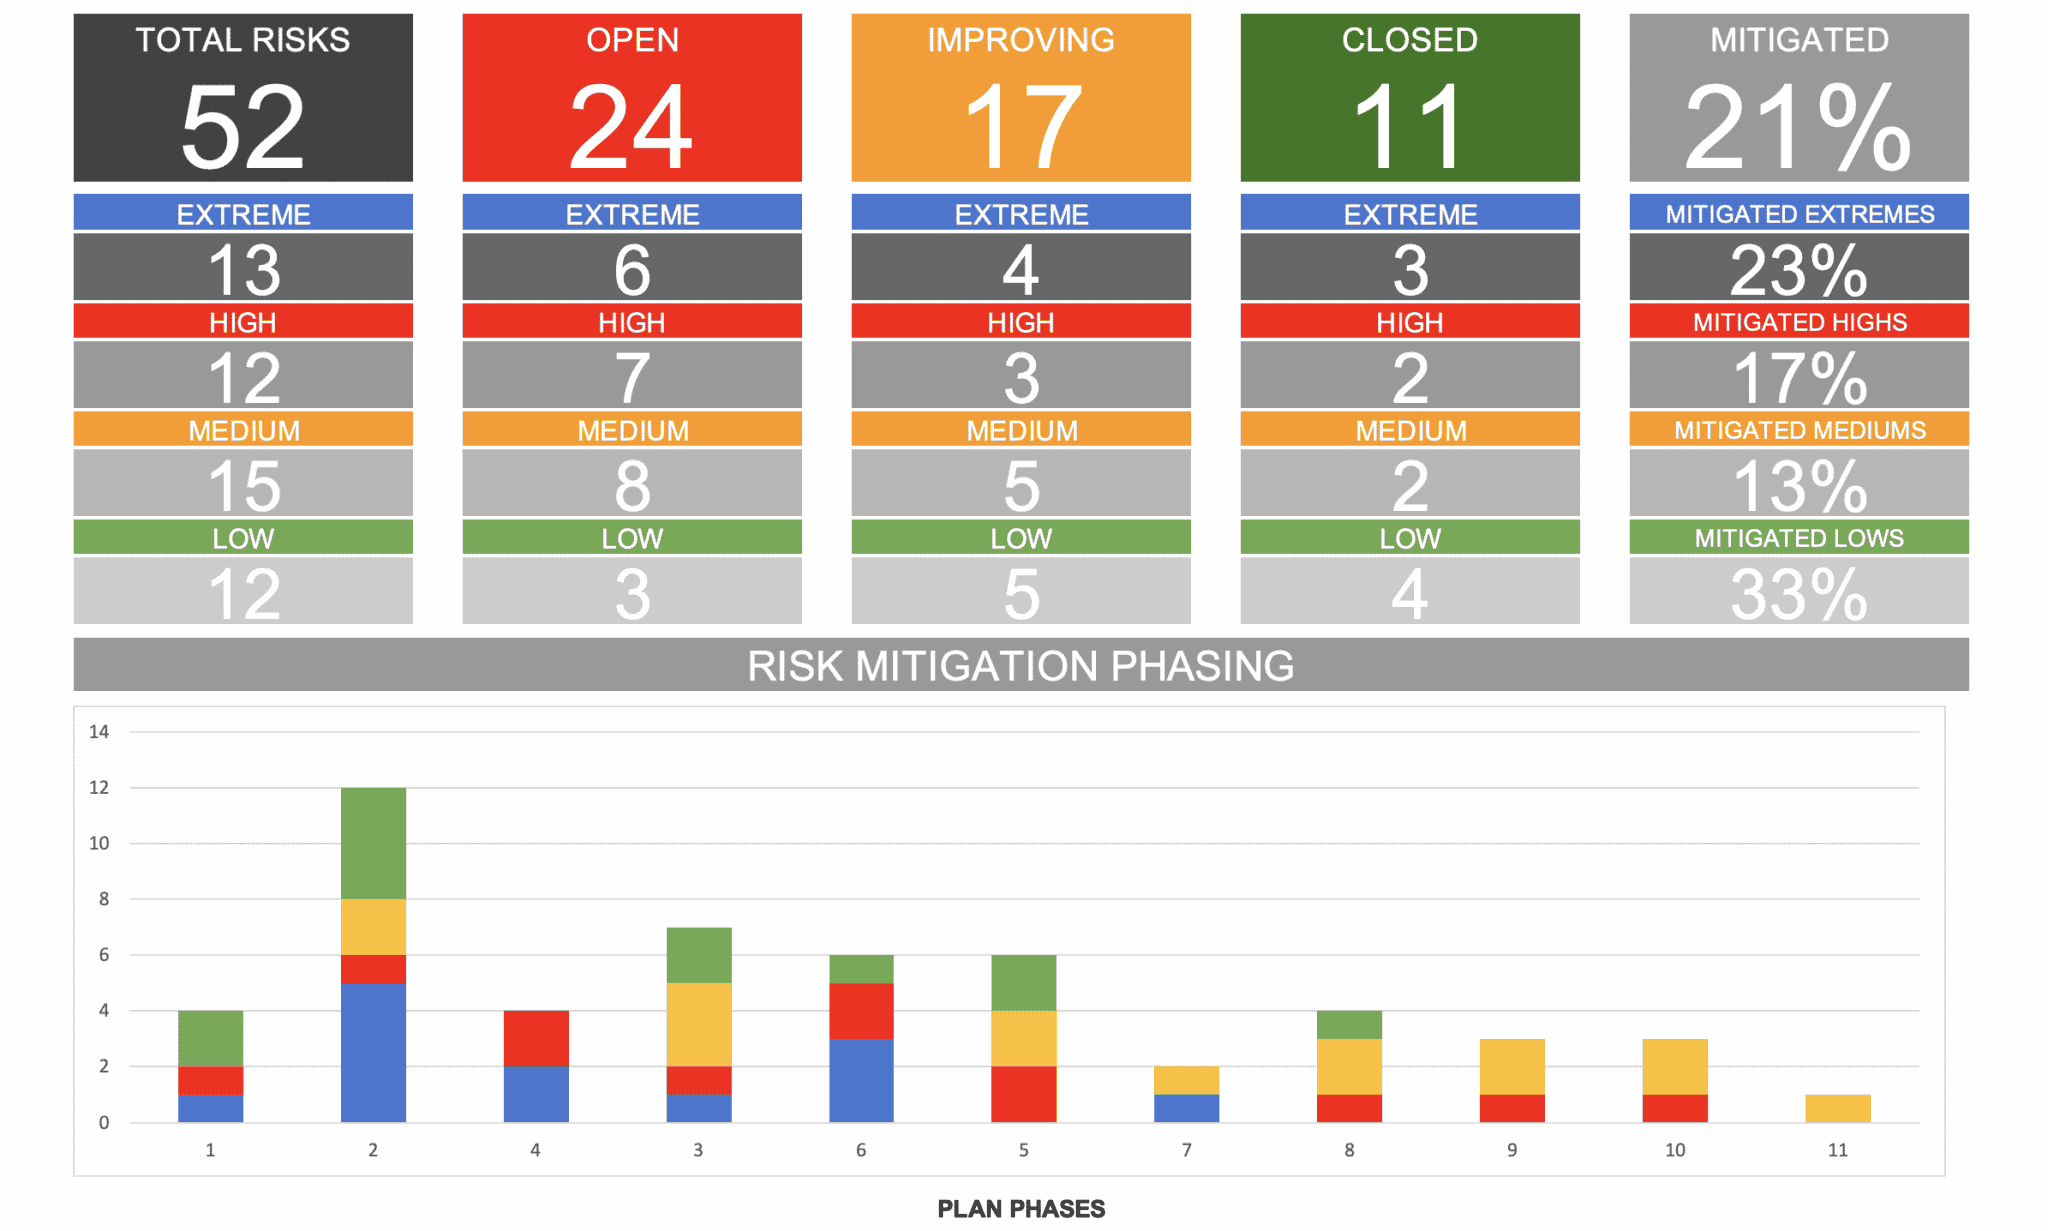
4 – Create an Infographic Summary of your risks: Summarize the view of all of these risks with an easy-to-read infographic.
RAG – Red Amber Green – is useful, but many project managers prefer to use a more descriptive approach to avoid confusion. e.g. “Risk Severity” with values: Extreme / High / Moderate / Low.
Depending on the project, the Risk Log that powers your dashboard should be updated daily, weekly, or every “iteration”/Sprint.
1 – Risk Severity (calculated by an Impact x Likelihood matrix).
2 – Open Risks vs Mitigated (“Closed”) Risks.
3 – Improving vs Deteriorating.
4 – % of Risks Mitigated (“Closed”).
5 – Date for target Risk Mitigation.
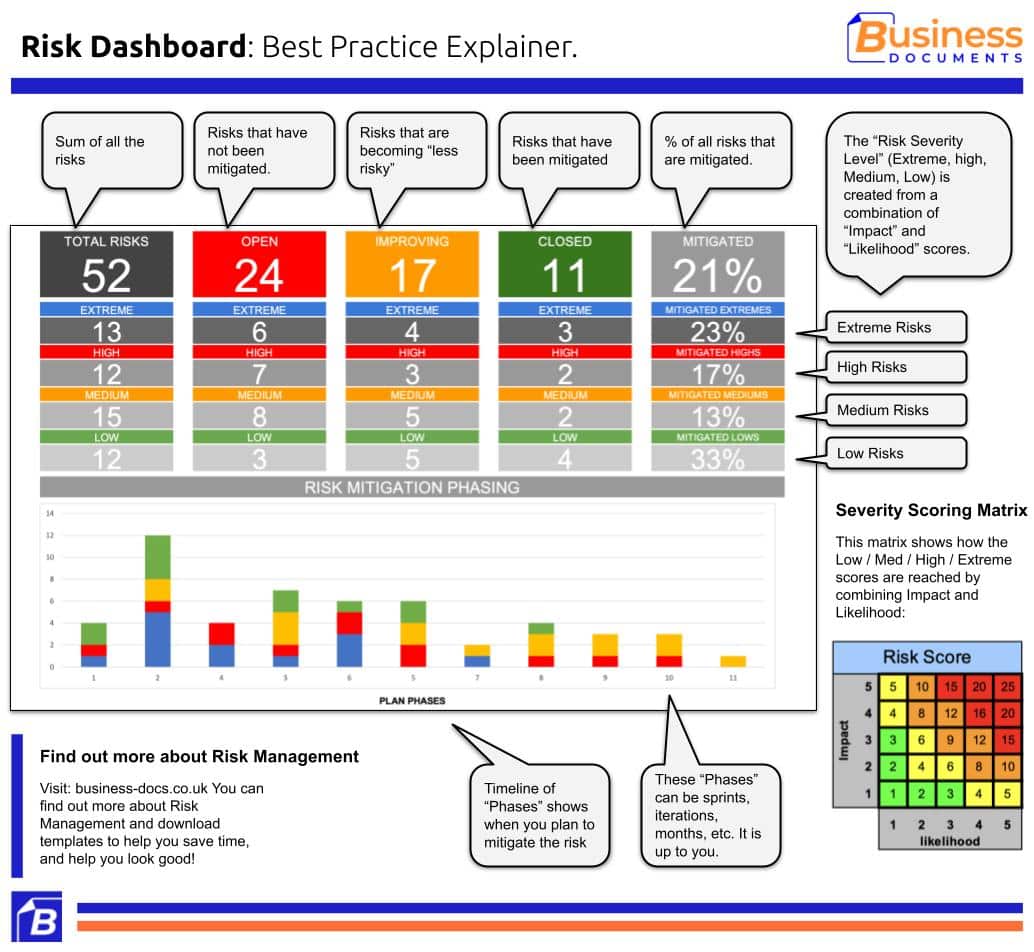
A Risk Dashboard is a graphic representation of a project’s risk profile, in a format that is easy to understand in just one minute. It clearly highlights the important risk aspects, like risk severity and mitigation status.
Risk Severity Level Scoring
You should assess the impact and likelihood of each risk so that you can summarise “Risk severity“.
The “impact” of a risk is the damage, or the effect, if it turns into an issue. i.e. when it is a risk you are talking about what MIGHT happen. Then, if it does happen, that risk turns into an issue with “impact”.
The “likelihood” of a risk describes the probability of it turning into an issue. i.e. While it is a “risk” you are talking about what MIGHT happen, so what is the probability that it WILL happen? This is its “likelihood”.
Each can be scored with a 1-5, where “1” is “low likelihood” or “low impact”, and “5” is extremely likely, or extreme impact.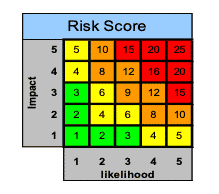
Once you have scored a risk for “likelihood” and “impact”, you multiply the values on the matrix to give you an overall “Risk Severity” score using this table:
1-3: “Low risk”.
4-6: “Moderate risk”.
8-12: “High risk”.
15-25: “Extreme risk”.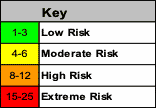
Are you short on time?
Use these templates to help with this Best Practice:

Solution-focused Excel Risk Log with Dashboard Template
This Risk Log template supports a Solution-focused Risk Management strategy by combining a powerful Risk Dashboard with Mitigation Data. Show HOW and WHEN your risks will be mitigated, and WHO owns them.
See: Solution-focused Excel Risk Log with Dashboard Template
RAID Log Excel Template
This RAID Log Excel Template helps you track detailed Risks, Assumptions, Issues and Dependencies and presents them on a summary Dashboard for easy understanding. Great for Board Reports and Status Reports.
See: RAID Log Excel TemplateBusiness Topics that support this Best Practice
Risk Management Templates

RAG Status Template PowerPoint
The RAG Status Template provides a range of RAG formats so that you can communicate project risk levels – Red, Amber, Green – quickly and easily.
See: RAG Status Template PowerPoint")
Project Status Report Template Discount Bundle (PPT & Excel)
All of our Project Status Report Template formats in one discount package. Enjoy our professional formats for delivery status, risk status, rollout status, and innovation status. All in easy-to-edit Powerpoint and Excel.
See: Project Status Report Template Discount Bundle (PPT & Excel)Risk Log and Transition Management Template Deal (PPT & Excel)
This Risk Log and Transition Management Template Pack provides professional risk logs, and transition planning tools. Download at more than 70% discount.
See: Risk Log and Transition Management Template Deal (PPT & Excel)Excel Transition Plan Template
The Microsoft Excel Transition Plan Template presents your transition in simple roadmap graphic, so that anyone can understand it rapidly. Starting state, plans, milestones, risk level and target state. Simple.
See: Excel Transition Plan TemplateTemplate and Guide Aspects that support this Best Practice
Risk Log Templates and Dashboard Formats
Risk Log and Transition Management Template Deal (PPT & Excel)
See: Risk Log and Transition Management Template Deal (PPT & Excel)")

Templates and Best Practice in this Business Ecosystem

Operations
Operations is a key function in any business. Led by the COO, operations can cover a wide range of business-critical processes.
See: Operations
Project Management
Browse our Project Management resources and materials here. From market-leading templates, to expert insights.
See: Project Management