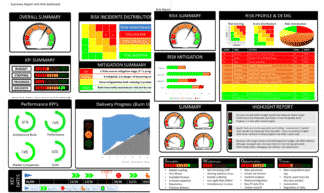
Dashboard Report (Powerpoint)
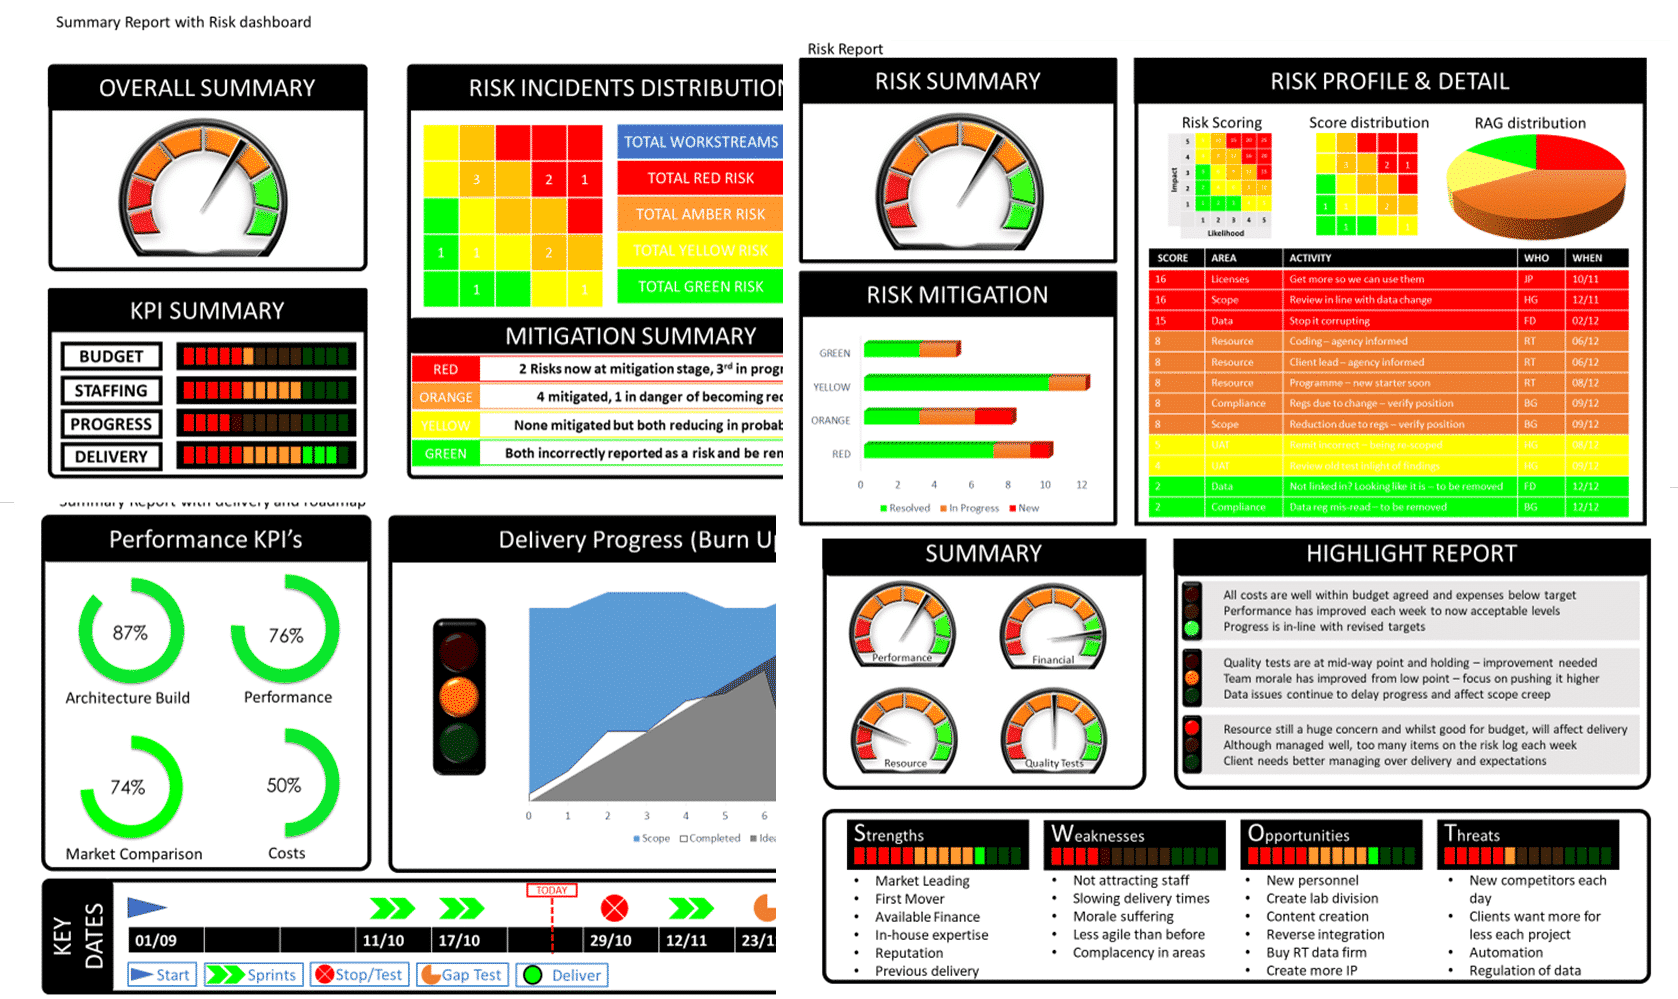
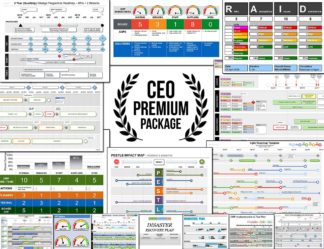
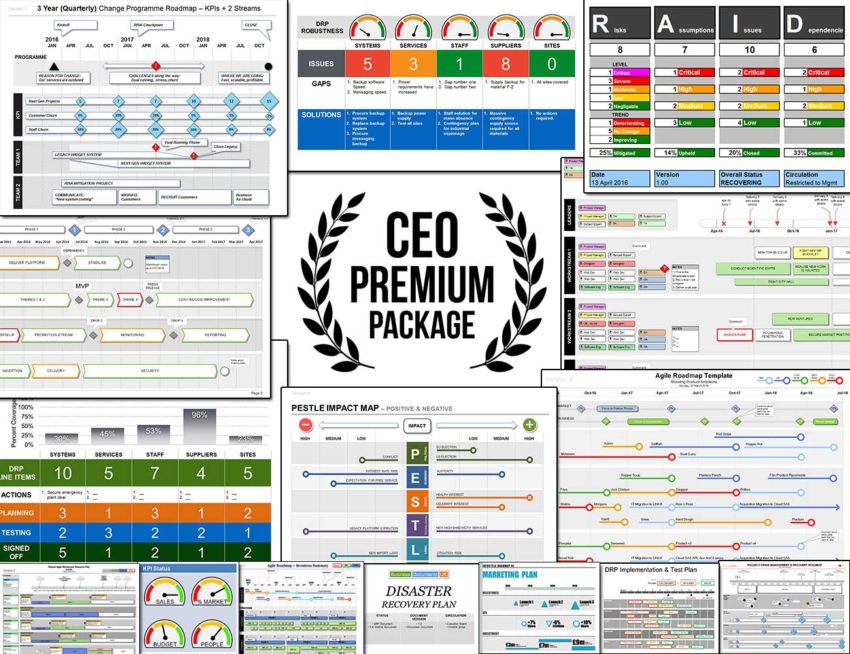
A dashboard report powerpoint perfect for updating key stakeholders on projects against delivery, including overall summary, RAG, Risk, SWOT, Dials, Highlights and a Roadmap.
This dashboard report pack will impress key stakeholders with clear information when you need to provide project updates.
Ideal for projects of all sizes to report at a senior and executive level.
The Dashboard Report Template includes
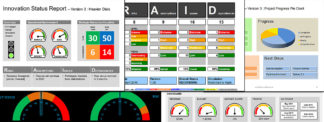
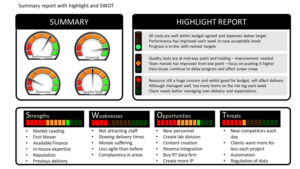
- Overall Summary dials to clearly show progress.
- Key Performance Indicator dials to demonstrate how well the project is going.
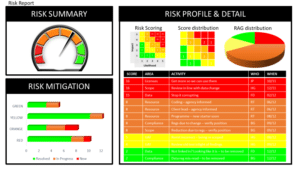
- Risk profile and mitigation summary.
- Delivery progress (burn up).
- Key dates.
- Summary dials by area.
- Highlight report with RAG status.
- SWOT report with RAG status.
- Risk profile and details of mitigation progress.
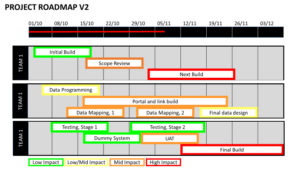
- Delivery Roadmap (two different styles).
Dynamic Status Dials
The status dials are not just images. The needles are moved by embedded excel data within the powerpoint. This can be linked into your own data sources if required or left as standalone. Instructions are included as notes alongside the slides to aide changes which are straight forward.
Contents
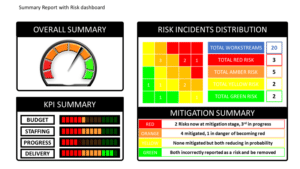
1. Summary report to communicate risk.
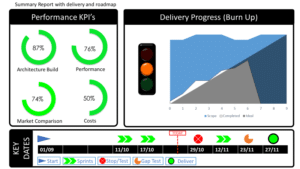
2. Performance KPI’s dashboard, delivery progress and key date roadmap.
3. Summary report status by area, RAG highlight report and Swot with indicators.
4. Risk summary, profile, details of incidents raised and mitigation history.
5. Roadmap (two different styles).
