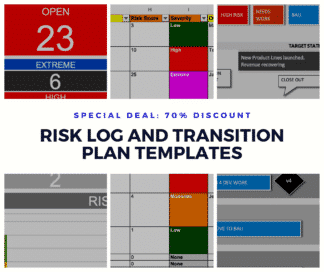
Solution-focused Excel Risk Log with Dashboard Template

This Risk Log template supports a Solution-focused Risk Management strategy by combining a powerful Risk Dashboard with Mitigation Data. Show HOW and WHEN your risks will be mitigated, and WHO owns them.
Risk Log Features
This Risk Log template features a range of tools to track and communicate your risk analysis. It offers the usual summarisation of each risk likelihood and impact into a combined score, and it counts the risks in various statuses so that you can get a project overview.
Crucially, it supports project leaders in planning when they are going to close the risks – the Risk Mitigation Schedule.
- Risk Log – a standard risk table, with filters
- Title – “There is a risk that …”
- Project Area – Which part of your project does the risk affect?
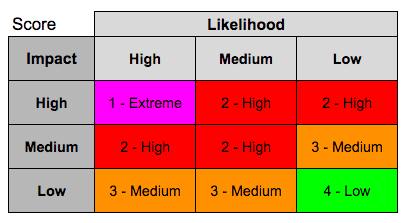
- Impact – How severe is the impact if the risk materialises?
- Likelihood – How likely is the risk to materialise?
- Score – How serious is the Risk? This is automatically calculated by combining Impact and Likelihood scores
- Impact Description – What happens if the risk materialises (i.e. becomes an Issue)
- Owner – Who is in charge of mitigating the Risk?
- Mitigation Task – How will the Risk be mitigated?
- Target Mitigation Phase – When will the Risk be mitigated?
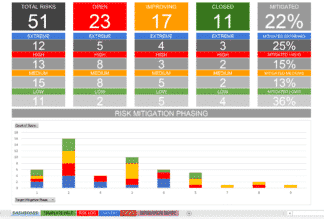
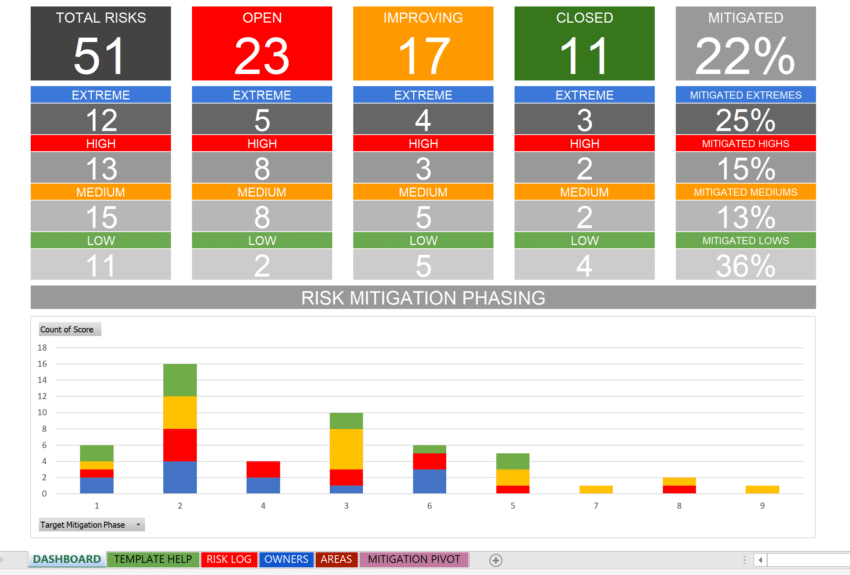
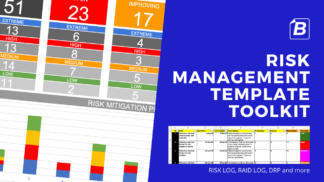
- Dashboard – show executives and sponsors the status at a glance.
- Total – the total count of risks.
- Open – the count of risks unaddressed.
- Improving – the count of risks are in the process of being mitigated and are improving?
- Closed – the count of risks that have been closed.
- % Mitigated – What percentage of your project risks have been mitigated and closed?
- Risk Mitigation Phasing Chart
- Shows the cut of which severity of risks are planned for which project phase.
- Mitigation Pivot
- This pivot table provides data for the Target Mitigation Phase chart.
- NB when using Excel, the Pivot Table must be updated before the chart updates.
- When using Google Sheets, the pivot and chart are automatically updated.
- Owners.
- This is a pivot table that shows a count of risks for each owner that you have listed in the Risk Log sheet.
- Areas.
- This Pivot table counts the risks and scores by risk area.
- This is compiled from the entries you have created in the Risk Log sheet.
- Template Help.
- This sheet offers some simple help steps to guide you through using the template.
Automatic Risk Score Calculated from Likelihood and Impact.
Risk Dashboard
This Risk Log is Google Sheets compatible
This template can be uploaded and used in Google Sheets. NB – not for free distribution – this template is only usable as per the terms of your license.
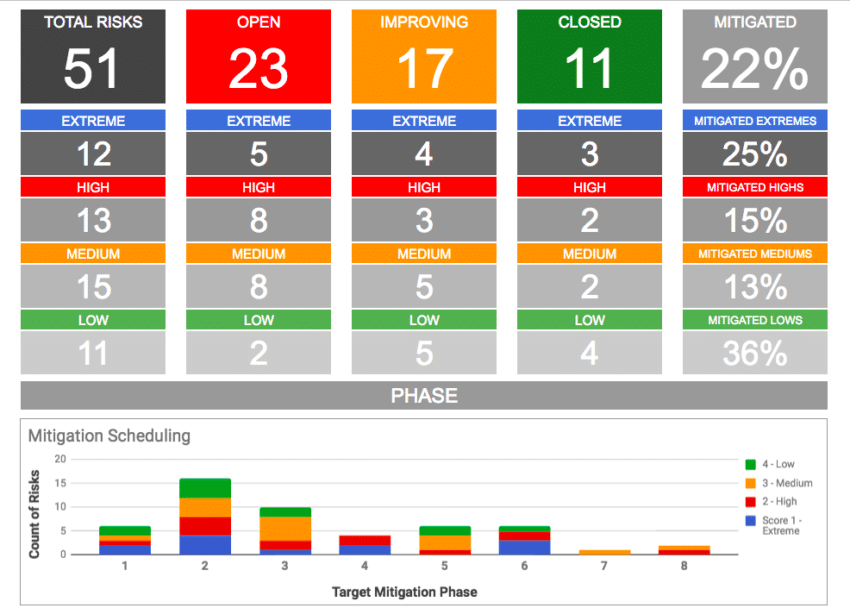
When uploading to Google Sheets, the Mitigation Scheduling chart may need to be recreated using the values in the “MITIGATION PIVOT” worksheet.
The Risk Log with Dashboard & Scheduled Mitigation Template also comes with a help worksheet.
This Product is included in these discount bundles:
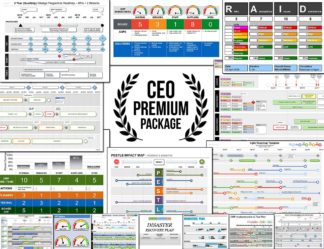
The CEO Premium Bundle

All Templates in 1 Bundle – The CEO Premium Package
Get all of our professional templates in ONE PACKAGE. 100+ templates with over 70% discount, and a multi-user license.
Business Best Practice

How do I score Risk in a Risk Log?
Find out how to score risk, using impact and likelihood, on your risk log. Find templates and avoid problems.
Read more here
How to create a Risk Dashboard
This guide will walk you through the process of creating a risk dashboard for your project. We’ll discuss how to create metrics and what should be included on the dashboard.
Read more here