Find out how to score risk, using impact and likelihood, on your risk log. Find templates and avoid problems.
First, estimate how likely it is that your risk is going to turn into a real issue:
1 = It is very unlikely that this will happen.
5 = It is going to happen.
Second, score how bad the impact is if your risk does turn into a real issue:
1 = It will not make much difference to our project.
5 = It will cause our project to fail.
Finally, multiply these two together, and you get a score from 1 to 25 to compare risk levels across your risks, and prioritise your attention and resources accordingly.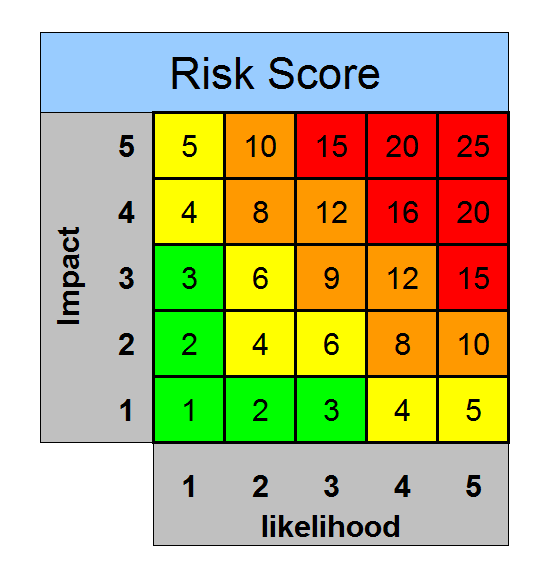
More about Risk Scoring
Risk Scoring Matrix: Impact vs Likelihood
- A score of 1 is “Low Risk”.
- A score of 25 is “Extremely High Risk”.
Assigning Likelihood Values
- Rare: A very unlikely event. It could happen, but probably never will. Below 5%
- Unlikely: Not expected. Slight possibility. An improbable sequence of events. 5% – 25%
- Possible: Moderate likelihood. Foreseeable. May have occurred in projects like this before. 25% – 50%
- Likely: Strong possibility. High likelihood. An easily foreseeable event. 50% – 75%
- Almost Certain: Almost certain without any intervention. Above 75%.
Assigning Risk Impact Values
- Insignificant: The project will have to make some minor changes to scope. Resolvable by project team. Can be managed. Acceptible.
- Minor: Some changes to deliverables.
Outside of Project Tollerances or Contingency.
Adjustment to scope with some impact. - Moderate: One or more areas likely not to deliver as planned. Descoping required. Significant impact.
- High: Significant descoping required.
Major Impact. - Extreme: Serious failure of project objectives. Disastrous Impact.
You then multiply your Impact and Likelihood scores together. See the Risk Scoring Matrix below to quickly ascertain the risk level.
Risk Scoring Matrix
Use this scoring to prioritise your risks
This risk scoring is a useful tool to prioritise the effort in your project to mitigate the most important risks first.
Use Risk Mitigation to reduce the risk levels
As you move through your project, and manage your risks with your Risk Log, you will plan mitigation steps for each risk. These mitigation steps may not remove the risk completely, but they should reduce the impact and/or the likelihood of that risk.
Problems with Scoring Risks with a Matrix
There are many ways to allocate weighting to risks, and to group severity, with no right or wrong answer. The allocation of severity groupings helps you give summaries to your colleagues, but the groupings you choose will need to vary depending on the project type, size and environment.
See more here on Wikipedia about the problems with Risk Matrices.
Example Guidance for Project Managers according to Risk Severity
- Extreme
Escalate immediately to project authorities.
Include recommendations.
Actively control. - High
Manage immediately.
Inform project authorities.
Act on mitigation and ensure you have response plans ready. - Moderate
Manage risk and escalate in normal reporting.
Watch carefully for change in exposure. - Low
Manage risk.
Are you short on time?
Use these templates to help with this Best Practice:

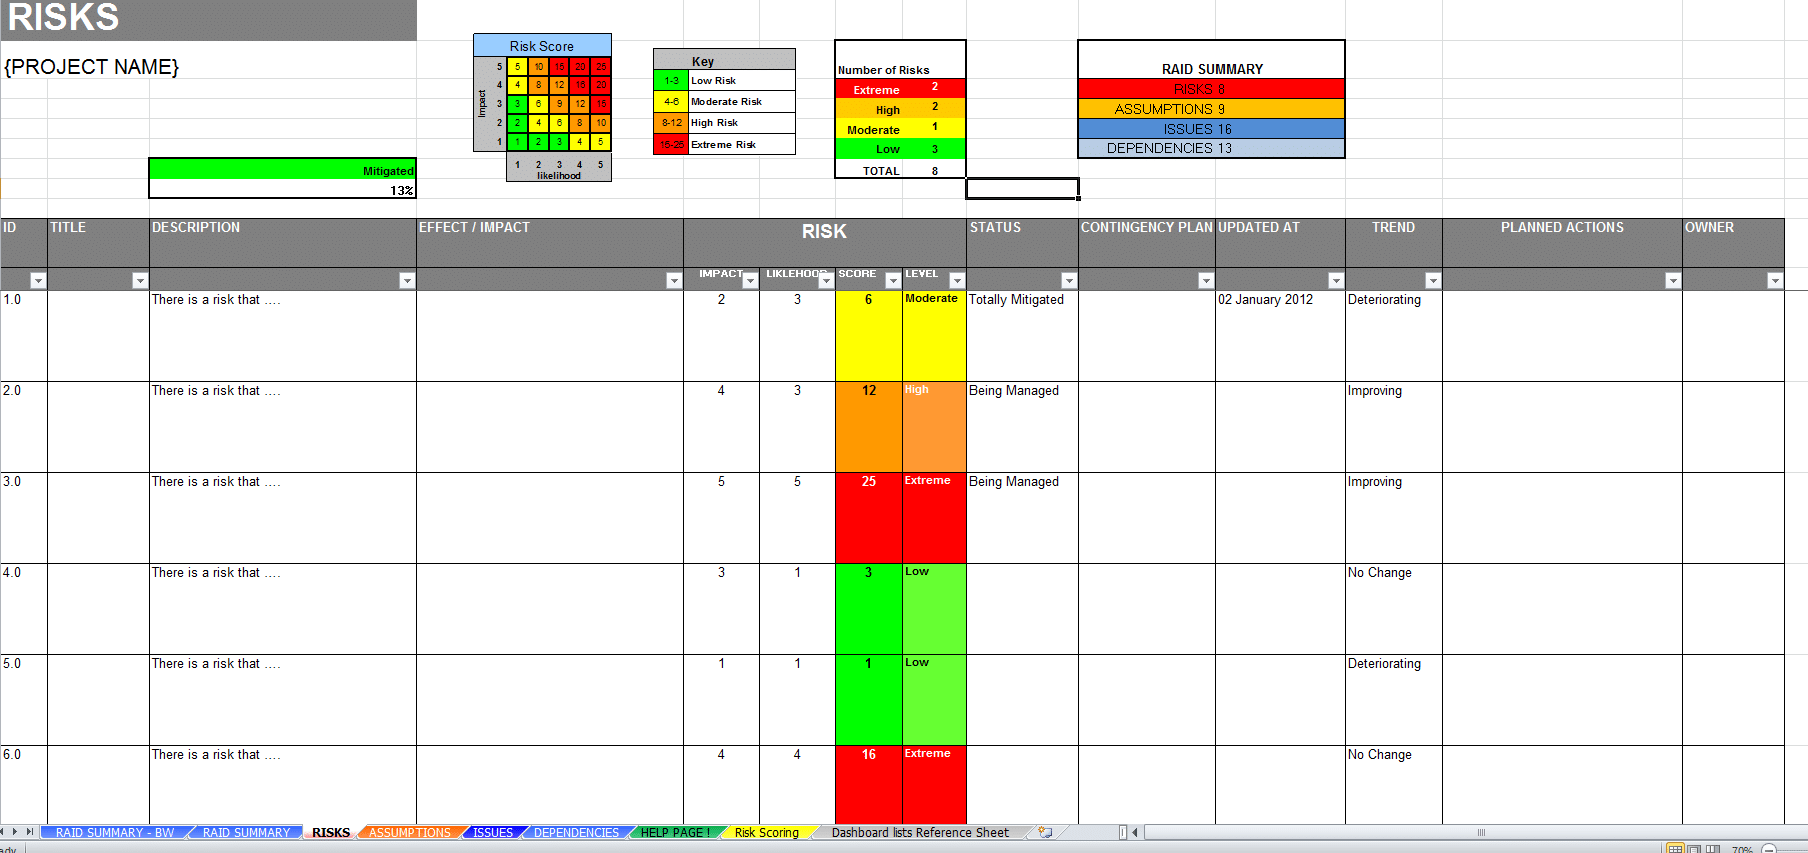
RAID Log Excel Template
This RAID Log Excel Template helps you track detailed Risks, Assumptions, Issues and Dependencies and presents them on a summary Dashboard for easy understanding. Great for Board Reports and Status Reports.
See: RAID Log Excel Template")
Simple Risk Log Template (Excel & Google Sheets)
This Simple Risk Log Template helps you to list your risks, track them, and see the summary status on the Dashboard: Number of severe, mitigated etc!
See: Simple Risk Log Template (Excel & Google Sheets)
Solution-focused Excel Risk Log with Dashboard Template
This Risk Log template supports a Solution-focused Risk Management strategy by combining a powerful Risk Dashboard with Mitigation Data. Show HOW and WHEN your risks will be mitigated, and WHO owns them.
See: Solution-focused Excel Risk Log with Dashboard Template")
Supplier Risk and Performance Dashboard Template (POCCET)
This Supplier Risk and Performance Dashboard template allows you to identify, present and manage the risk and performance of your Supplier portfolio.
See: Supplier Risk and Performance Dashboard Template (POCCET)Business Topics that support this Best Practice
Project Management

Agile Burn-Down and Burn-Up Template Excel
With this amazing tool you can create your burn-down and burn-up charts in minutes instead of hours. We’ve also saved you money by using Excel so that you don’t need to pay a monthly subscription fee – you can just use Google Sheets!
See: Agile Burn-Down and Burn-Up Template Excel
Project Report
A stylish PowerPoint project report which allows you to show your progress against the plan and budget.
See: Project Report
Project Handover PowerPoint
This captures the key elements of a project so you can deliver a smooth handover.
See: Project Handover PowerPointRisk Log and Transition Management Template Deal (PPT & Excel)
This Risk Log and Transition Management Template Pack provides professional risk logs, and transition planning tools. Download at more than 70% discount.
See: Risk Log and Transition Management Template Deal (PPT & Excel)Template and Guide Aspects that support this Best Practice
Risk Log Templates and Dashboard Formats
Risk Log and Transition Management Template Deal (PPT & Excel)
See: Risk Log and Transition Management Template Deal (PPT & Excel)
Risk Score

PMO - Project Management Office


RAID Log Formats & Templates - Risks Assumptions Issues & Dependencies
Risk Log and Transition Management Template Deal (PPT & Excel)
See: Risk Log and Transition Management Template Deal (PPT & Excel)
Templates and Best Practice in this Business Ecosystem

Operations
Operations is a key function in any business. Led by the COO, operations can cover a wide range of business-critical processes.
See: Operations