
Find out how to create a Gantt Chart using Microsoft Excel the simple way. Avoid all the fuss – do it in minutes.
1. Set your timeline across the top. Each column should be a time unit – e.g. week / month.
2. Allocate a row underneath the timeline for “Milestones“.
3. Setup a row for each deliverable, as a list of line items underneath your Milestones row.
4. Make the first column larger to allow for deliverable titles.
5. Set out your deliverables in the rows arranged in time order, with the first one at the top.
6. Alternate the rows with two different colours or shades so that they are easy to differentiate at a glance.
7. Test it on a friend. Ask them “Is this easy to understand?” and optimise it with their feedback.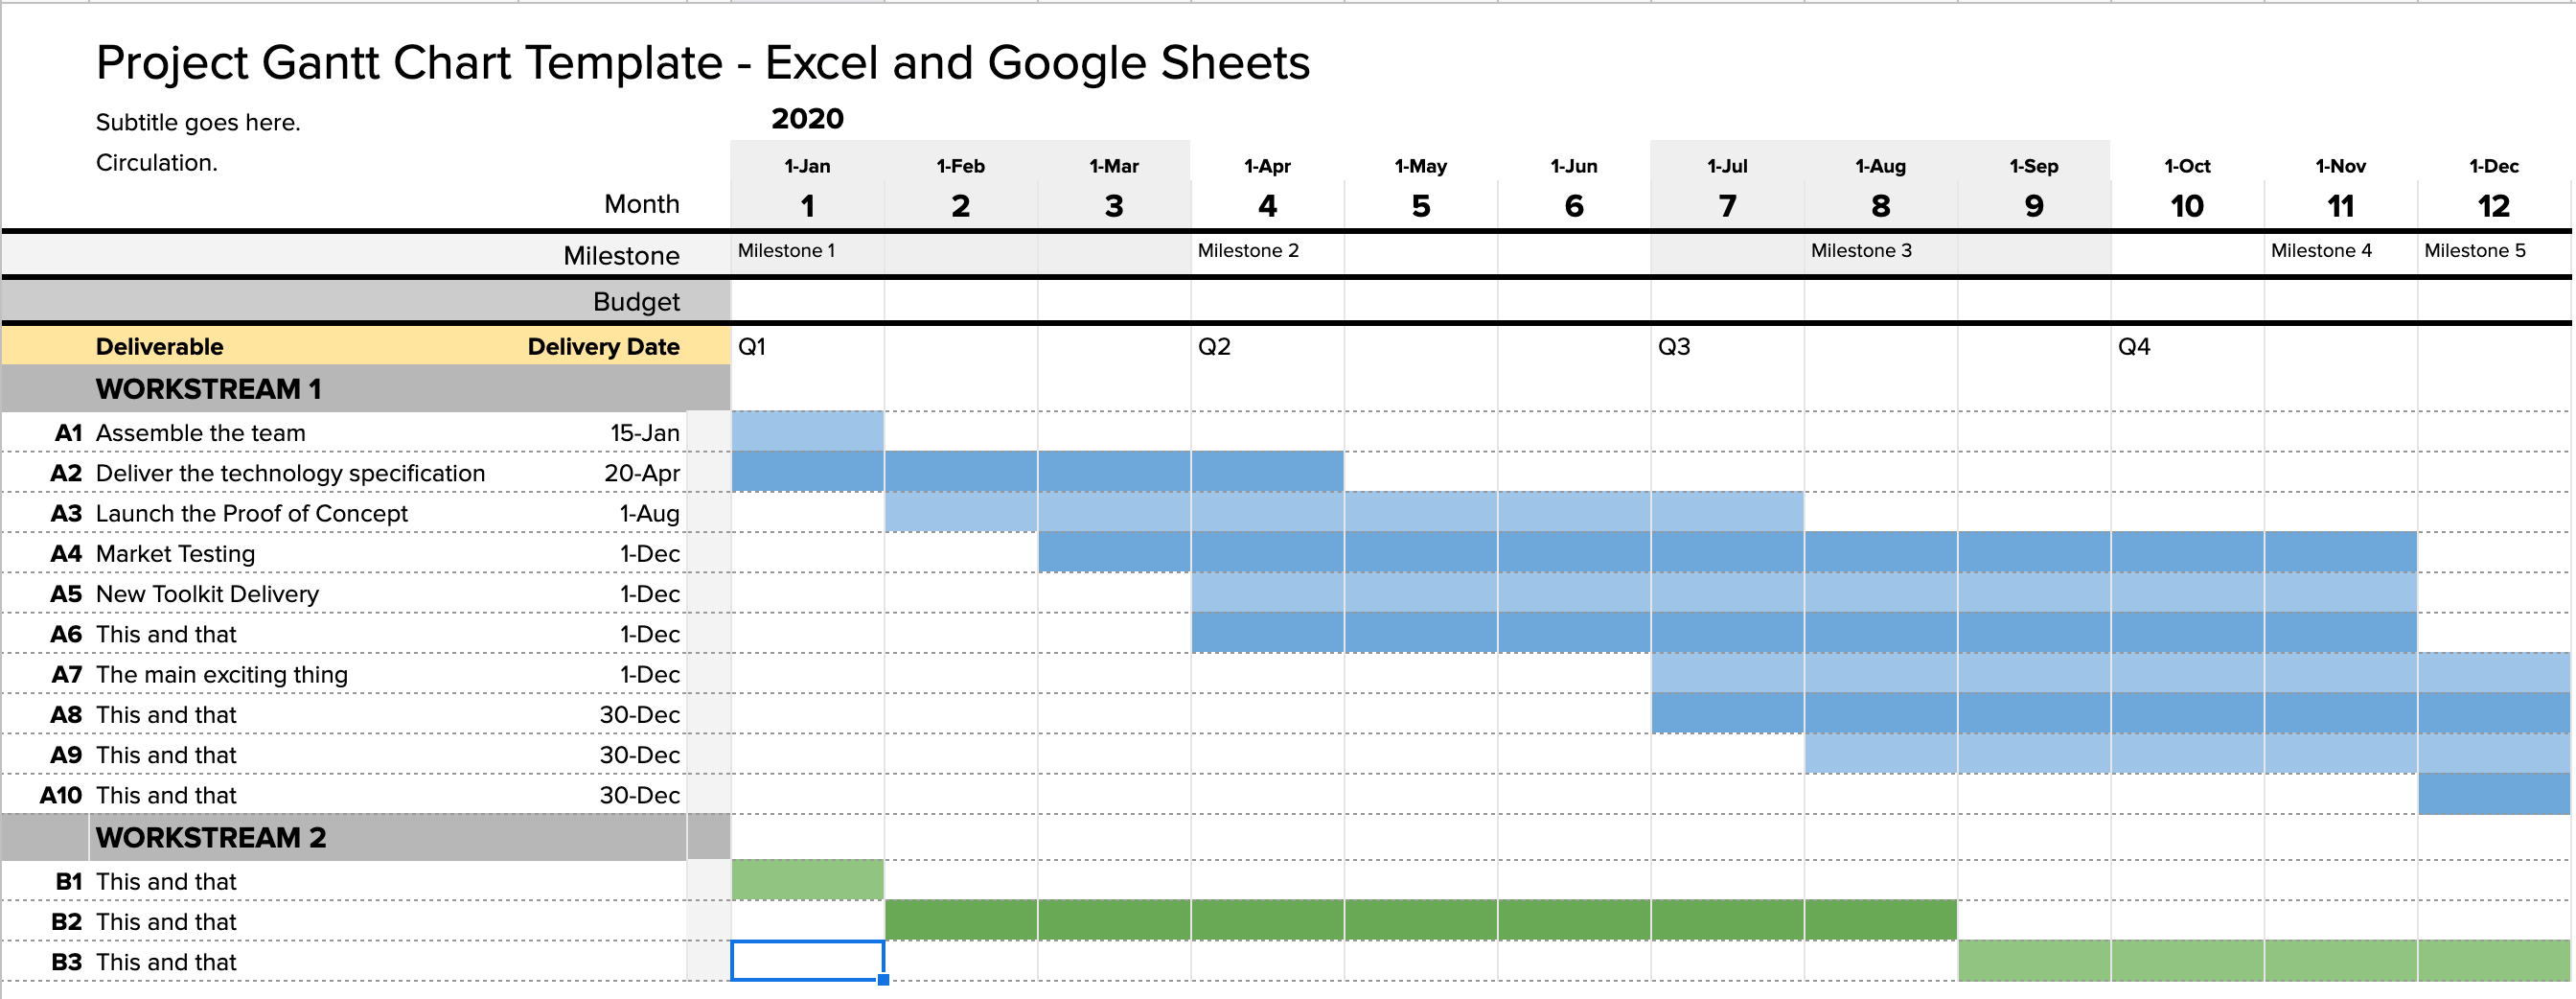
Avoid all the dynamic elements: simply use the excel cell shading and copying features to save time.
1. Timeline: Set the first few date increments horizontally across the top, then drag across and Excel does the rest.
2. Deliverables: Set the first few “deliverables” vertically down the left, then drag down and Excel magically uses your format.
3. Gantt bars: Use cell shading to create Gantt bars, and alternate the shades for each line to make it easy to read.
4. Milestones: Include a row at the top to highlight important Milestones.
Avoid common Gantt mistakes
- Don’t make your Gantt Chart too complex! It should fit on one side of A4.
- Keep it up to date! Things change as a project rolls out, so make sure you update it regularly.
- Keep the number of milestones manageable! Too many milestones makes people lose focus.
Example Excel Template

Are you short on time?
Use these templates to help with this Best Practice:

Gantt Chart Excel Template – create a well-presented Gantt in a Spreadsheet
Create a gantt chart in Microsoft Excel quickly with this Gantt Chart Excel Template. It includes 12 month, 18 month and 24 month formats, with 2-4 workstreams. The format is Google Sheets compatible.
See: Gantt Chart Excel Template – create a well-presented Gantt in a SpreadsheetBusiness Topics that support this Best Practice
Gantt Chart Excel Templates
")
Google Sheets Compatible Roadmap Template (Excel)
This Google Sheets Roadmap Template can be uploaded and used on Google Drive (G Suite) for business, so that you can use our professional roadmap layouts easily.
See: Google Sheets Compatible Roadmap Template (Excel)Risk Log and Transition Management Template Deal (PPT & Excel)
This Risk Log and Transition Management Template Pack provides professional risk logs, and transition planning tools. Download at more than 70% discount.
See: Risk Log and Transition Management Template Deal (PPT & Excel)Excel Transition Plan Template
The Microsoft Excel Transition Plan Template presents your transition in simple roadmap graphic, so that anyone can understand it rapidly. Starting state, plans, milestones, risk level and target state. Simple.
See: Excel Transition Plan TemplateGantt Chart Excel Template – create a well-presented Gantt in a Spreadsheet
Create a gantt chart in Microsoft Excel quickly with this Gantt Chart Excel Template. It includes 12 month, 18 month and 24 month formats, with 2-4 workstreams. The format is Google Sheets compatible.
See: Gantt Chart Excel Template – create a well-presented Gantt in a SpreadsheetGantt Chart Templates & Alternatives
Google Sheets Compatible Roadmap Template (Excel)
This Google Sheets Roadmap Template can be uploaded and used on Google Drive (G Suite) for business, so that you can use our professional roadmap layouts easily.
See: Google Sheets Compatible Roadmap Template (Excel)Risk Log and Transition Management Template Deal (PPT & Excel)
This Risk Log and Transition Management Template Pack provides professional risk logs, and transition planning tools. Download at more than 70% discount.
See: Risk Log and Transition Management Template Deal (PPT & Excel)Excel Transition Plan Template
The Microsoft Excel Transition Plan Template presents your transition in simple roadmap graphic, so that anyone can understand it rapidly. Starting state, plans, milestones, risk level and target state. Simple.
See: Excel Transition Plan TemplateGantt Chart Excel Template – create a well-presented Gantt in a Spreadsheet
Create a gantt chart in Microsoft Excel quickly with this Gantt Chart Excel Template. It includes 12 month, 18 month and 24 month formats, with 2-4 workstreams. The format is Google Sheets compatible.
See: Gantt Chart Excel Template – create a well-presented Gantt in a SpreadsheetTemplate and Guide Aspects that support this Best Practice
Excel Templates
")
Project Status Report Template Discount Bundle (PPT & Excel)
See: Project Status Report Template Discount Bundle (PPT & Excel)Excel Templates Compatible with Google Sheets
Project Status Report Template Discount Bundle (PPT & Excel)
See: Project Status Report Template Discount Bundle (PPT & Excel)


Templates and Best Practice in this Business Ecosystem

Project Management
Browse our Project Management resources and materials here. From market-leading templates, to expert insights.
See: Project Management