“All style and no substance” is something that we have all heard before; uttered by way of a critique, not implying but forthrightly stating that a product, idea or even a person looks the part but this hides an absence of anything to back it up.
In our time we have seen our fair share of this; C.V.’s that are too good to be true and interviews that go so well you cannot believe you’ve found the right candidate (you haven’t). Our particular bug bear is gloriously presented power points which go swish and woosh and fly in and out of focus at the right time. And tell you precisely nothing except that you are really good at powerpoint and animations.
But what of the other way around?
If style over substance is annoying (and it is) what of substance withoutstyle?
All modern thoughts in the business world revolve now around the concept of brand, not just the company you work for or the product you sell, but of you, an individual. What do you represent when you walk into a room or stand on stage or present to the board for the first time? All sets of eyes are on you, its your moment to show them (delete as appropriate) why you are worth hiring / not firing / giving a pay rise / about to give a pay rise / promotion etc.
Even at a more mundane level, the first time you are asked to send detailed information to a board member or senior manager is often in the format of an attached document. Which at the end of the day represents you.
So a company selling templates is going to recommend buying good templates?
Yes. But not always.
We have genuinely witnessed many average people promoted, having presented their average work in a brilliant way over brilliant people presenting their work in an average way. Right or wrong, its just what we’ve seen.
Consider the audience, the requirement and the message you are trying to get across.
1. Don’t over do it
If you have been asked for a no-frill 5 line overview to be sent on an e-mail, we would recommend you produced exactly that.
After all, sometimes less really is more; you wouldn’t over engineer packaging for a single banana now would you?
2. Be clear
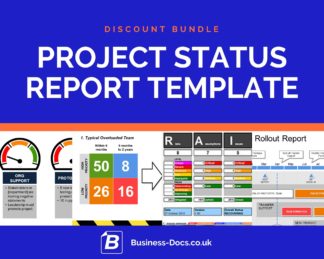
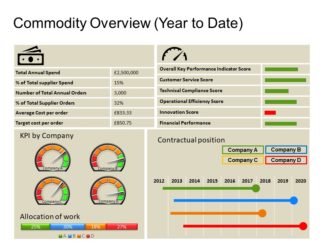
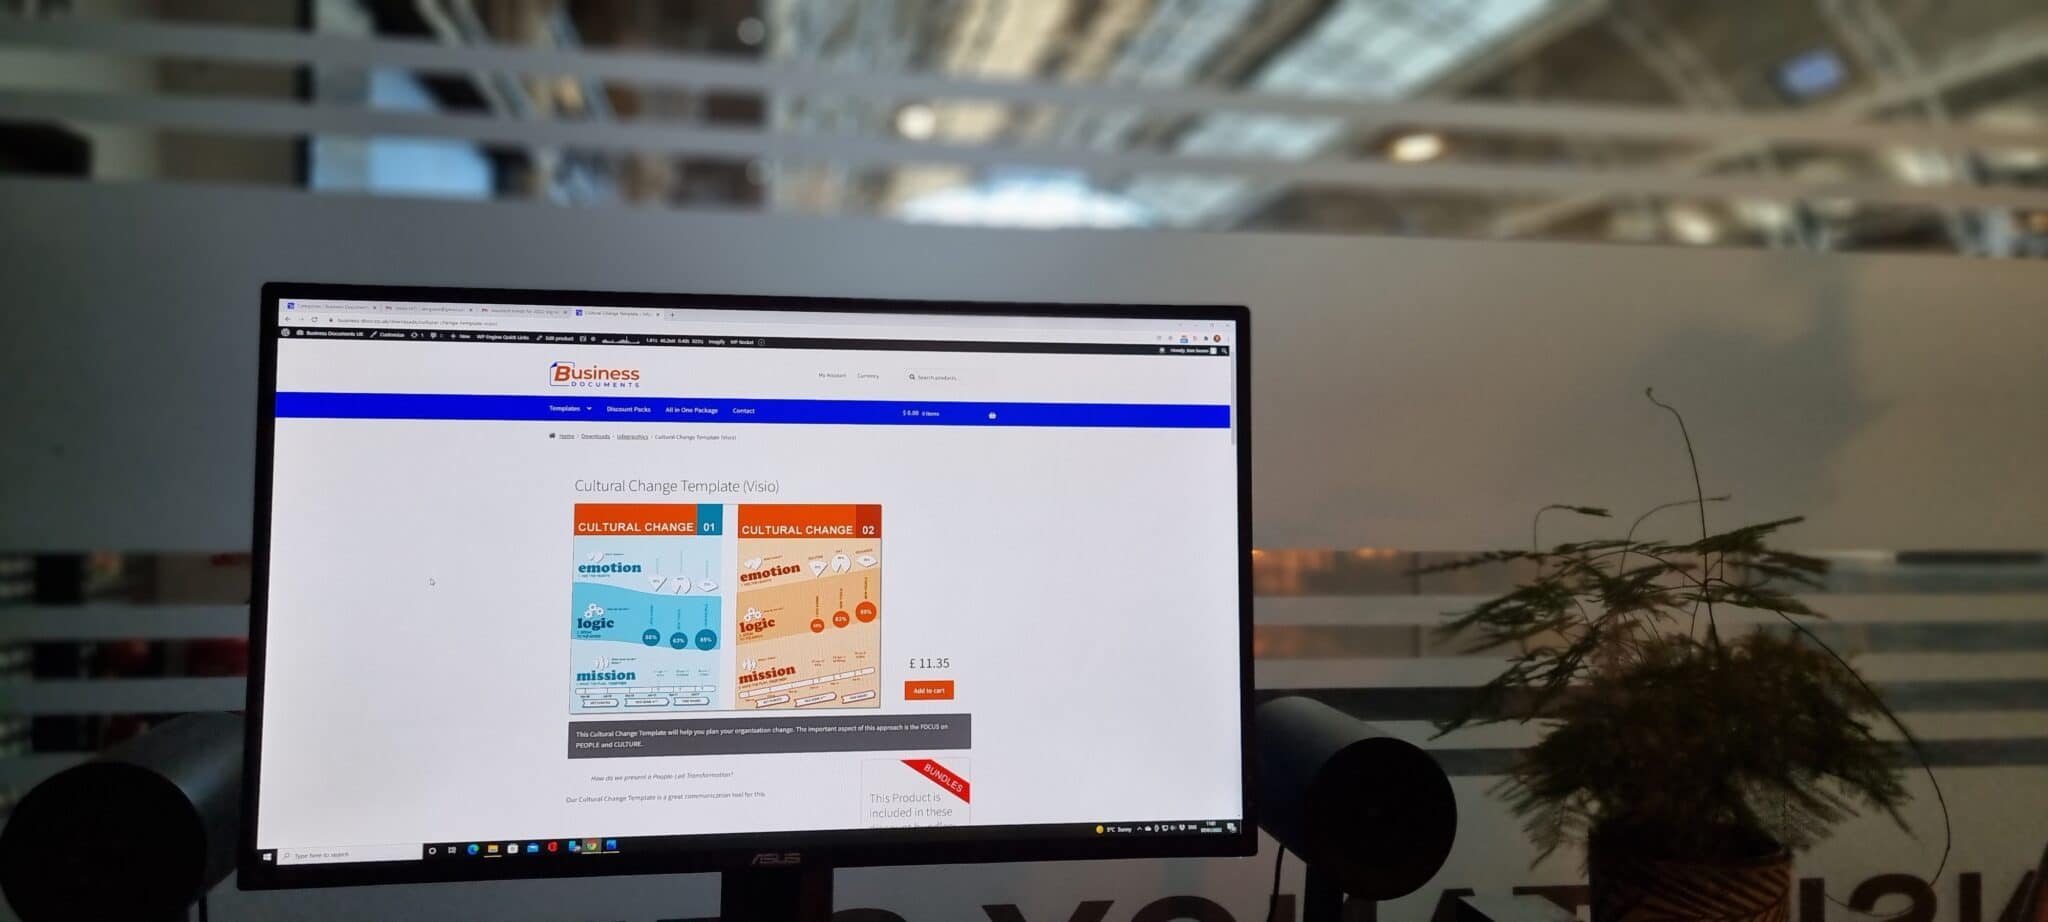
Use our templates, create your own, develop your unique style, use graphics and buttons or anything else you can think of.
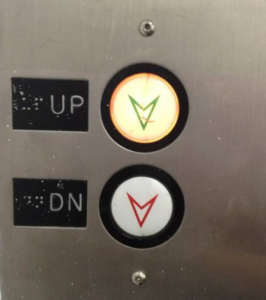
BUT if they are there because they are pretty and don’t tell you anything, take them out. Anything that does not add information in an easy to comprehend way that makes immediate sense is a huge distraction will subtract hugely from the rest of your hard work.
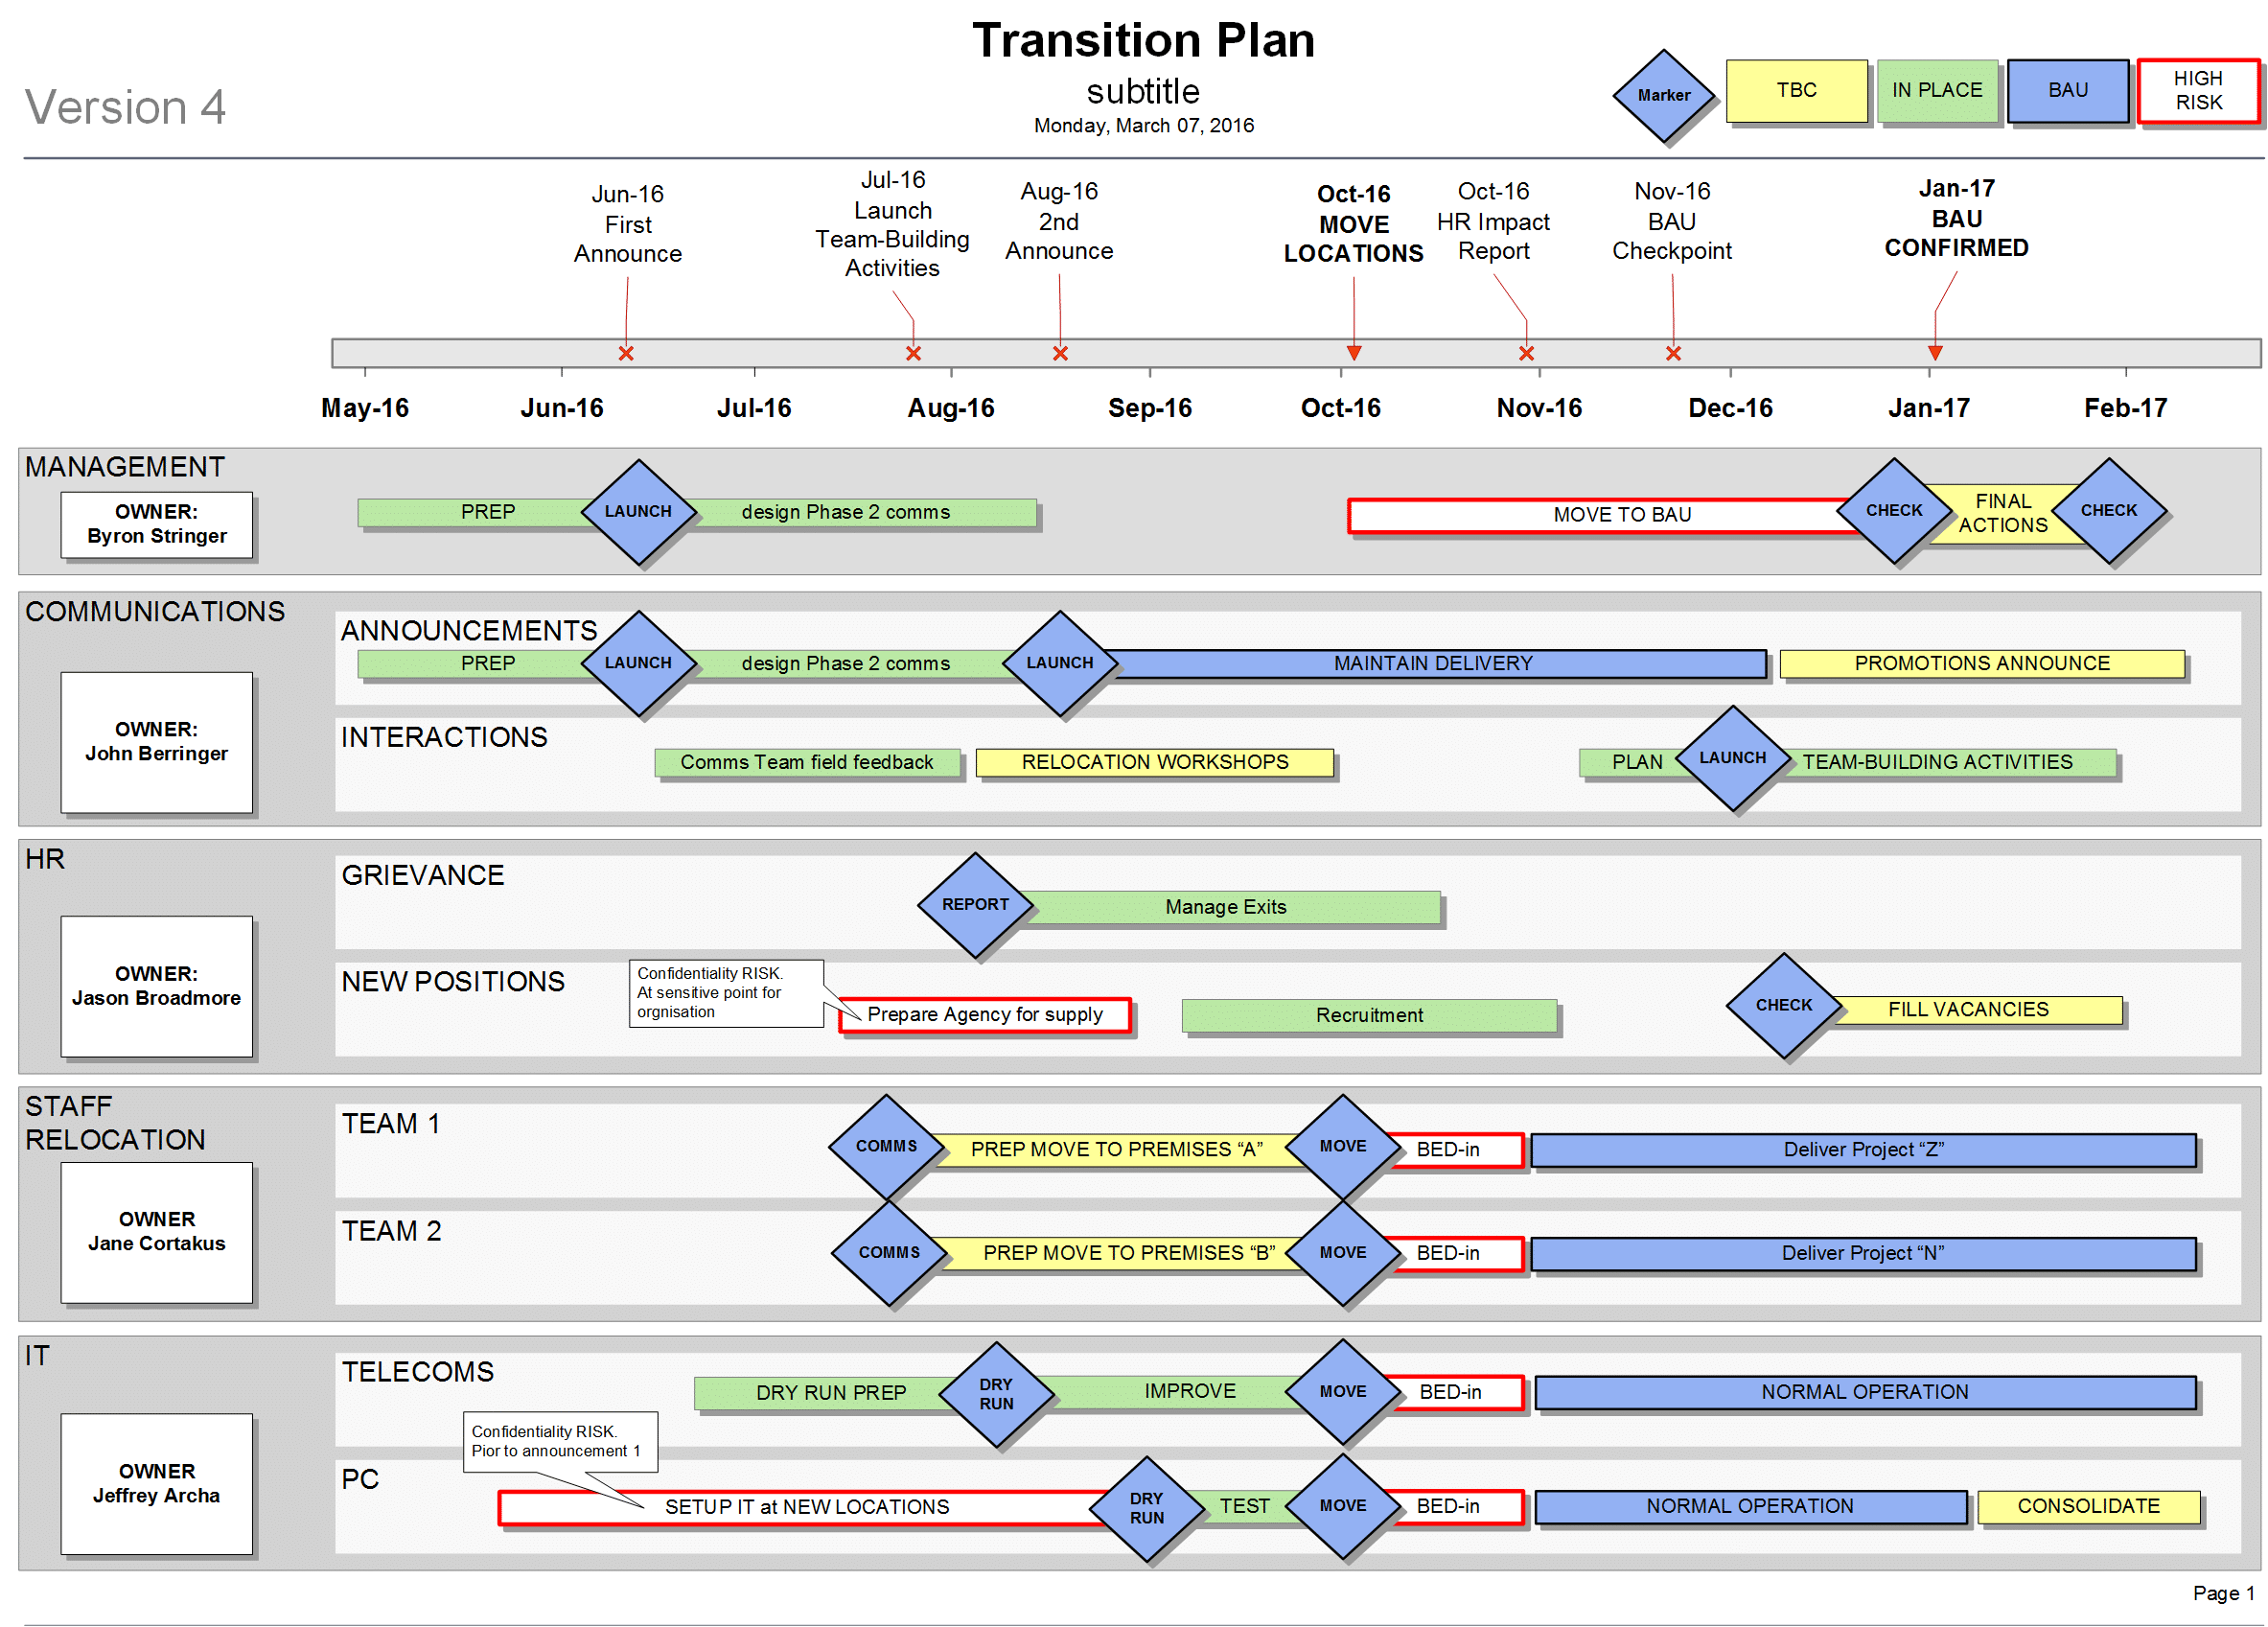
3. Be Consistent
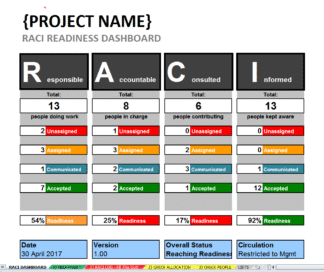
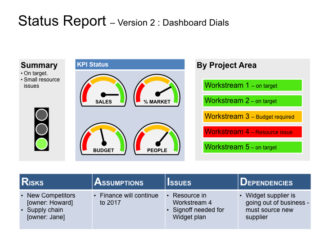
Define what and how you report and show this in the same way with the same criteria each time.
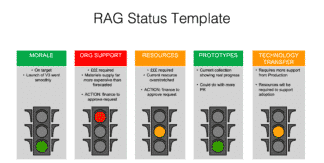
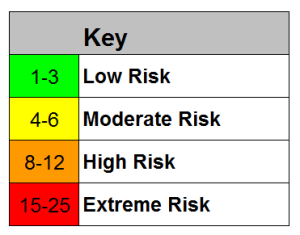
e.g. If you use Red Amber Green ratings on a dial and Amber is always 70% for instance, don’t have another report out there with a different dial and Green at 70%.
4. Take a step back and check it works
Sometimes we get too close to a project and struggle to convey information to those who do not know the ins and outs. Validate it with others to make sure that what you are trying to get across is actually what you are getting across.
Communicating a large amount of information on any project into a simple, easier to read and digest format is always something of a challenge. The trick is to focus on the key areas and “zoom” in on them.
We have read a fair bit of conventional wisdom which states that creating the ideal dashboard template should be kept simple (we agree) and that attempting to replicate the most traditional of dashboards in that of a car is to be avoided as it is not necessary. This struck a chord with us as we fundamentally disagreed – after all, cars display the most complex of information in a format which is universally accepted and which in spite of digital advances has remained largely the same using dials with redder bits akin to a RAG status.
So we started to build one and soon understood the reason behind conventional wisdom – making a car dashboard which is fully automated, pleasant on the eye and useful to those looking at it is really quite difficult! Being that difficult is our middle name (well it is documents but you get the gist) we would not take really quite difficult as an answer so persevered and finally late one night we had done it.
We are quite proud of it, but as ever, feedback is always welcome. As an added incentive, the first 5 people who can e-mail us with “How hard could it be” in the title will get a free version to give it a test drive.
We have been on some management courses over the last few months and having let the dust settle (thus avoiding the immediate post course evangelicalism which irks even the most tolerant mind) we have come to the conclusion that we have actually learnt a great deal and that it is relevant. And useful. And in some cases actually surprising!
1. Niche is good, no matter what your niche is. So long as there is a market.
Progressive Corp is an insurance company which focusses on all the types of people the other firms avoid like the plague.
So, know your market. REALLY know your market and show that you know it through market analysis tools. Such as Porters Five Forces or PEST.
2. Synergies are not always actually a good idea. Most companies have traditionally thought they are, but the world has changed.
It is more demanding and quite simply it is a tough market out there; focus on what you are good at, world class at, and do it.
This means that backwards or reverse integration is not the answer. Outsourcing is. Unless you are world class at it. (You get the gist). Japanese car manufacturers realised very early on that they were not as good as the electronic companies at making stereos, so they did not try and complete, they just struck up a deal. Get good at finding who in the market can deliver what you need for you, via procurement channels. Or have a look here.
3. IGNORE your customer. Yep, you read that right. Ignore them. Not on everything, of course, answer the phone, respond to e-mail and help them.
But think what would have happened if Steve Jobs had asked the mobile phone using public what they wanted from a phone and then given it to them? It would not have been anywhere near the i-phone by a long, long way. He didn’t ask, he gave them something they hadn’t even dreamed of yet.
4. Customise your output in what ever you do. Make it fit the needs of what you are doing not the other way around.
These are the highlights, there was a lot more!
If anything has struck you, contact us. If point 4 has struck a chord and you want to talk about how our content could be modified to fit your needs, PLEASE contact us. We shan’t follow our own advice concerning point 3!
There are many ways to measure and communicate risk – this is just one that we have found useful, and easy to communicate.
The 25 cell “Impact vs Likelihood” Risk Matrix is a popular format used to communicate Risk Scores. It helps you summarise your risks for project reporting.
The Risk Score Heatmap Matrix
This 5 x 5 (25 cell) matrix gives an easy way to associate a “Severity Score” with a Risk. NB you will see a lot of variations on this – so this is just one approach of many that Project Managers can take.
Risk Matrix used in the RAID Log
Each cell in the matrix is a combination of impact and likelihood.
This allows you to group your risks, based on a score, into some Risk Severity groups:
An approach to assigning Impact and Likelihood scores
Project Managers use a list of score definitions, to help one another assign and understand the scores for each risk.
Here is an example approach:
ASSIGNING RISK LIKLEHOOD VALUES
Score
Title
Likelihood
% Chance
1
Rare
Rare. A very unlikely event. It could happen, but probably never will.
Below 5%
2
Unlikely
Not expected. Slight possibility.
An improbable sequence of events.
5% – 25%
3
Possible
Moderate likelihood. Foreseeable. May have occurred in projects like this before.
25% – 50%
4
Likely
Strong possibility. High likelihood.
An easily foreseeable event.
50% – 75%
5
Almost Certain
Very likely.
Almost certain without any intervention.
Above 75%
ASSIGNING RISK IMPACT VALUES
Score
Title
Outcome / Impact / Consequence
Cost / Time / Scope
Implications
1
Insignificant
The project will have to make some minor changes to scope. Resolvable by management team.
Can be managed. Acceptible.
2
Minor
Some changes to deliverables.
Outside of Project Tollerances or Contingency.
Adjustment to scope with some impact.
3
Moderate
One or more areas likely not to deliver as planned. Descoping required.
Significant impact.
4
High
Significant descoping required.
Major Impact.
5
Extreme
Serious failure of project objectives.
Disastrous Impact.
Example Guidance for Project Managers according to Risk Severity
GENERAL GUIDANCE ON RISK MANAGEMENT
Extreme
Escalate immediately to project authorities.
Include recommendations.
Actively control.
High
Manage immediately.
Inform project authorities.
Act on mitigation and ensure you have response plans ready.
Moderate
Manage risk and escalate in normal reporting.
Watch carefully for change in exposure.
Low
Manage risk.
Problems with Scoring Risks with a Matrix
There are many ways to allocate weighting to risks, and to group severity, with no right or wrong answer. The allocation of severity groupings helps you give summaries to your colleagues, but the groupings you choose will need to vary depending on the project type, size and environment.
Project Managers manage their Risks in a “RAID Log”.
RAID Logs are used by project managers and programme managers to track and manage project risks.
Many projects have 10s and sometimes 100s of Risks to manage, and so it is essential to keep track of severity, status, next steps, and who owns each risk.