Not everyone knows how to use MS Project, and even if you do know it – this Gantt Chart Excel will save you a ton of time!
Using project management software to create Gantt charts gives you more trouble than it is worth. Instead, you should use MS Excel to create your plans, and you will have increased flexibility and speed. Here’s why.
Creating your project gantt chart is not an easy task.
Firstly, using project management software to create gantt charts requires knowledge and experience with the software.
Secondly, in order to create the gantt chart you are required to enter data, and to group the tasks in certain ways.
Finally, fitting the gantt chart on a one side of paper, or on one presentation slide, with everything legible is a challenge! The formatting is often constrained by the software, and you don’t have control over the emphasis of different project elements.
The Gantt chart can take you hours, especially if you are new to MS Project.
Getting all of this together in time for your presentation can be arduous!
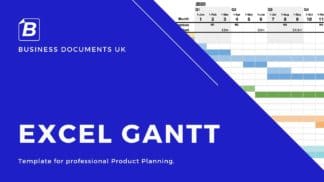
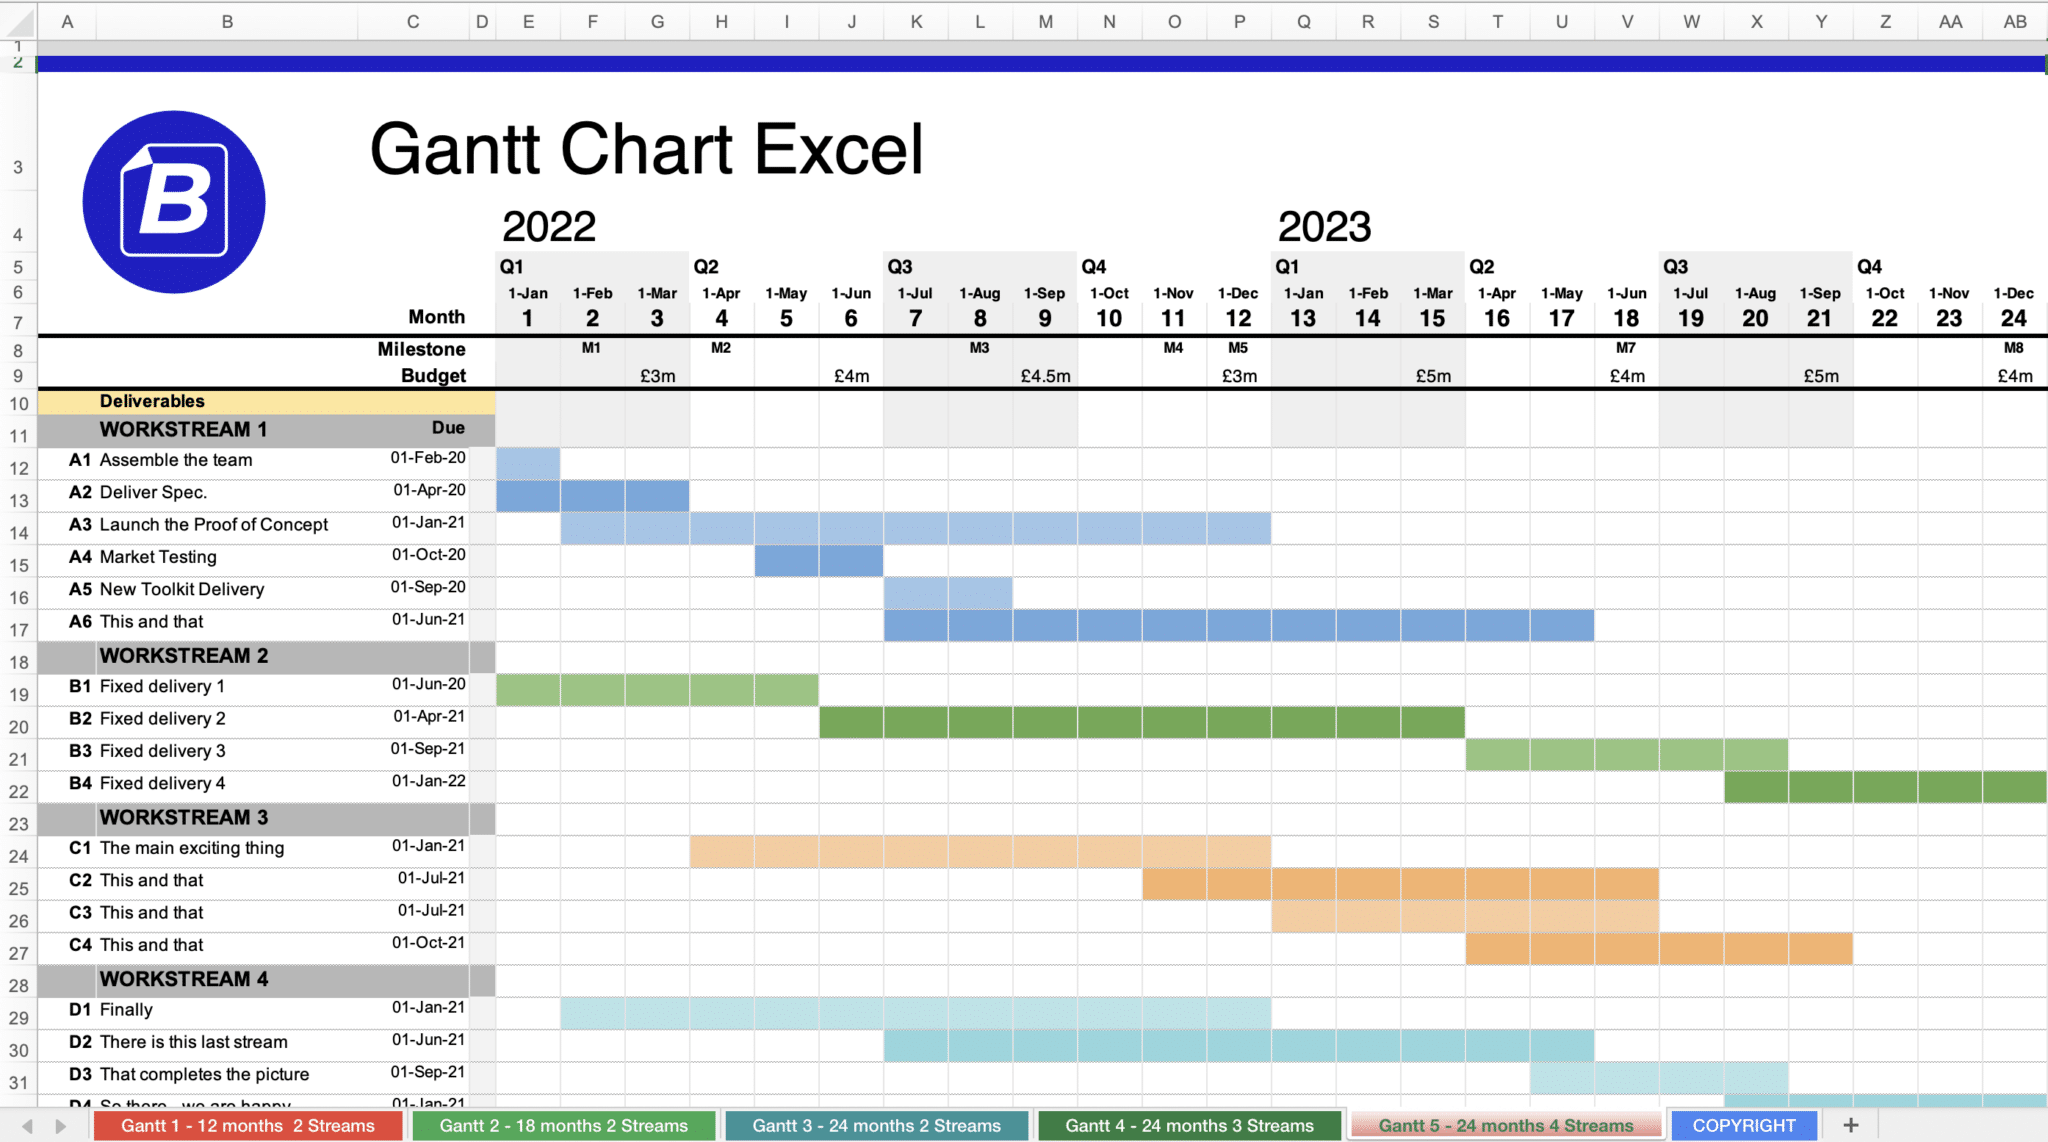
This is the reason why we created an easy to use Excel template for creating project gantt charts with Microsoft Excel. You will be able to create your schedule in minutes without any need of learning how to deal with MS Project software.
Solution: Use Excel to make a Gantt rapidly
Our Gantt Chart Excel template will help you make the most beautiful gantt chart for your projects in just minutes. It’s so simple that it doesn’t require any special training or skills! Just add the template to our shopping cart, checkout securely, download, and enter the data from your project plan sheet into our spreadsheet and see how amazing it looks at once! By using our Gantt Chart Excel template, creating visually appealing schedules has never been easier. Try now – this format is used by professionals around the world!
Some Gantt FAQs
1. You have to learn how to use MS Project.
2. They take a long time to create.
3. They can be complex to read.
4. You have limited control over layout and emphasis.
1. It has clear timeline.
2. It is easily legible, including only the important task bars.
3. It fits on one A4 side / on one slide.
4. It shows only the important milestones.
The fastest way is to use an Excel template to create a Gantt chart. While MS Project is often used, this requires learning how to use the software, and accurate data entry.
1. You can create it with simple Excel editing tools.
2. You have full control of the visual emphasis of different project elements.
3. You can mix Agile and Waterfall sequences and approaches.
4. You do not need to enter lots of data to build the chart.
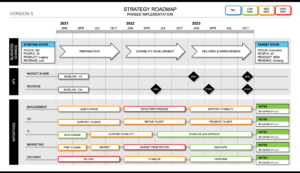
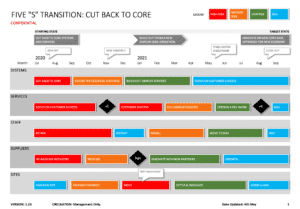
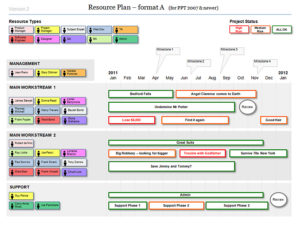
Using an Excel Gantt Chart, you can show a mixture of sequential and continuous project delivery processes. Rows can be shown as continuous task bars, and you can even write “Agile iterations” and show regular breaks inside a task bar.

