How to show the levels of risk, in a useful way, on a Project or Product Roadmap, so that it can be understood quickly.
Use a “Red, Amber, Green” approach – this is also known as “RAG Status”.
Show a key in your Roadmap Legend.
Label each Roadmap item (each project item within each work stream) with Red, Amber or Green.
Some professionals choose to use a “TBD” (to be decided) colour coding too, if an item has not yet been assessed.
RAG is an acronym that stands for “Red”, “Amber” and “Green”. Red is used for High Risk, Amber for Medium Risk, and Green for low risk. It is used due to it being familiar with traffic lights used in road traffic management.
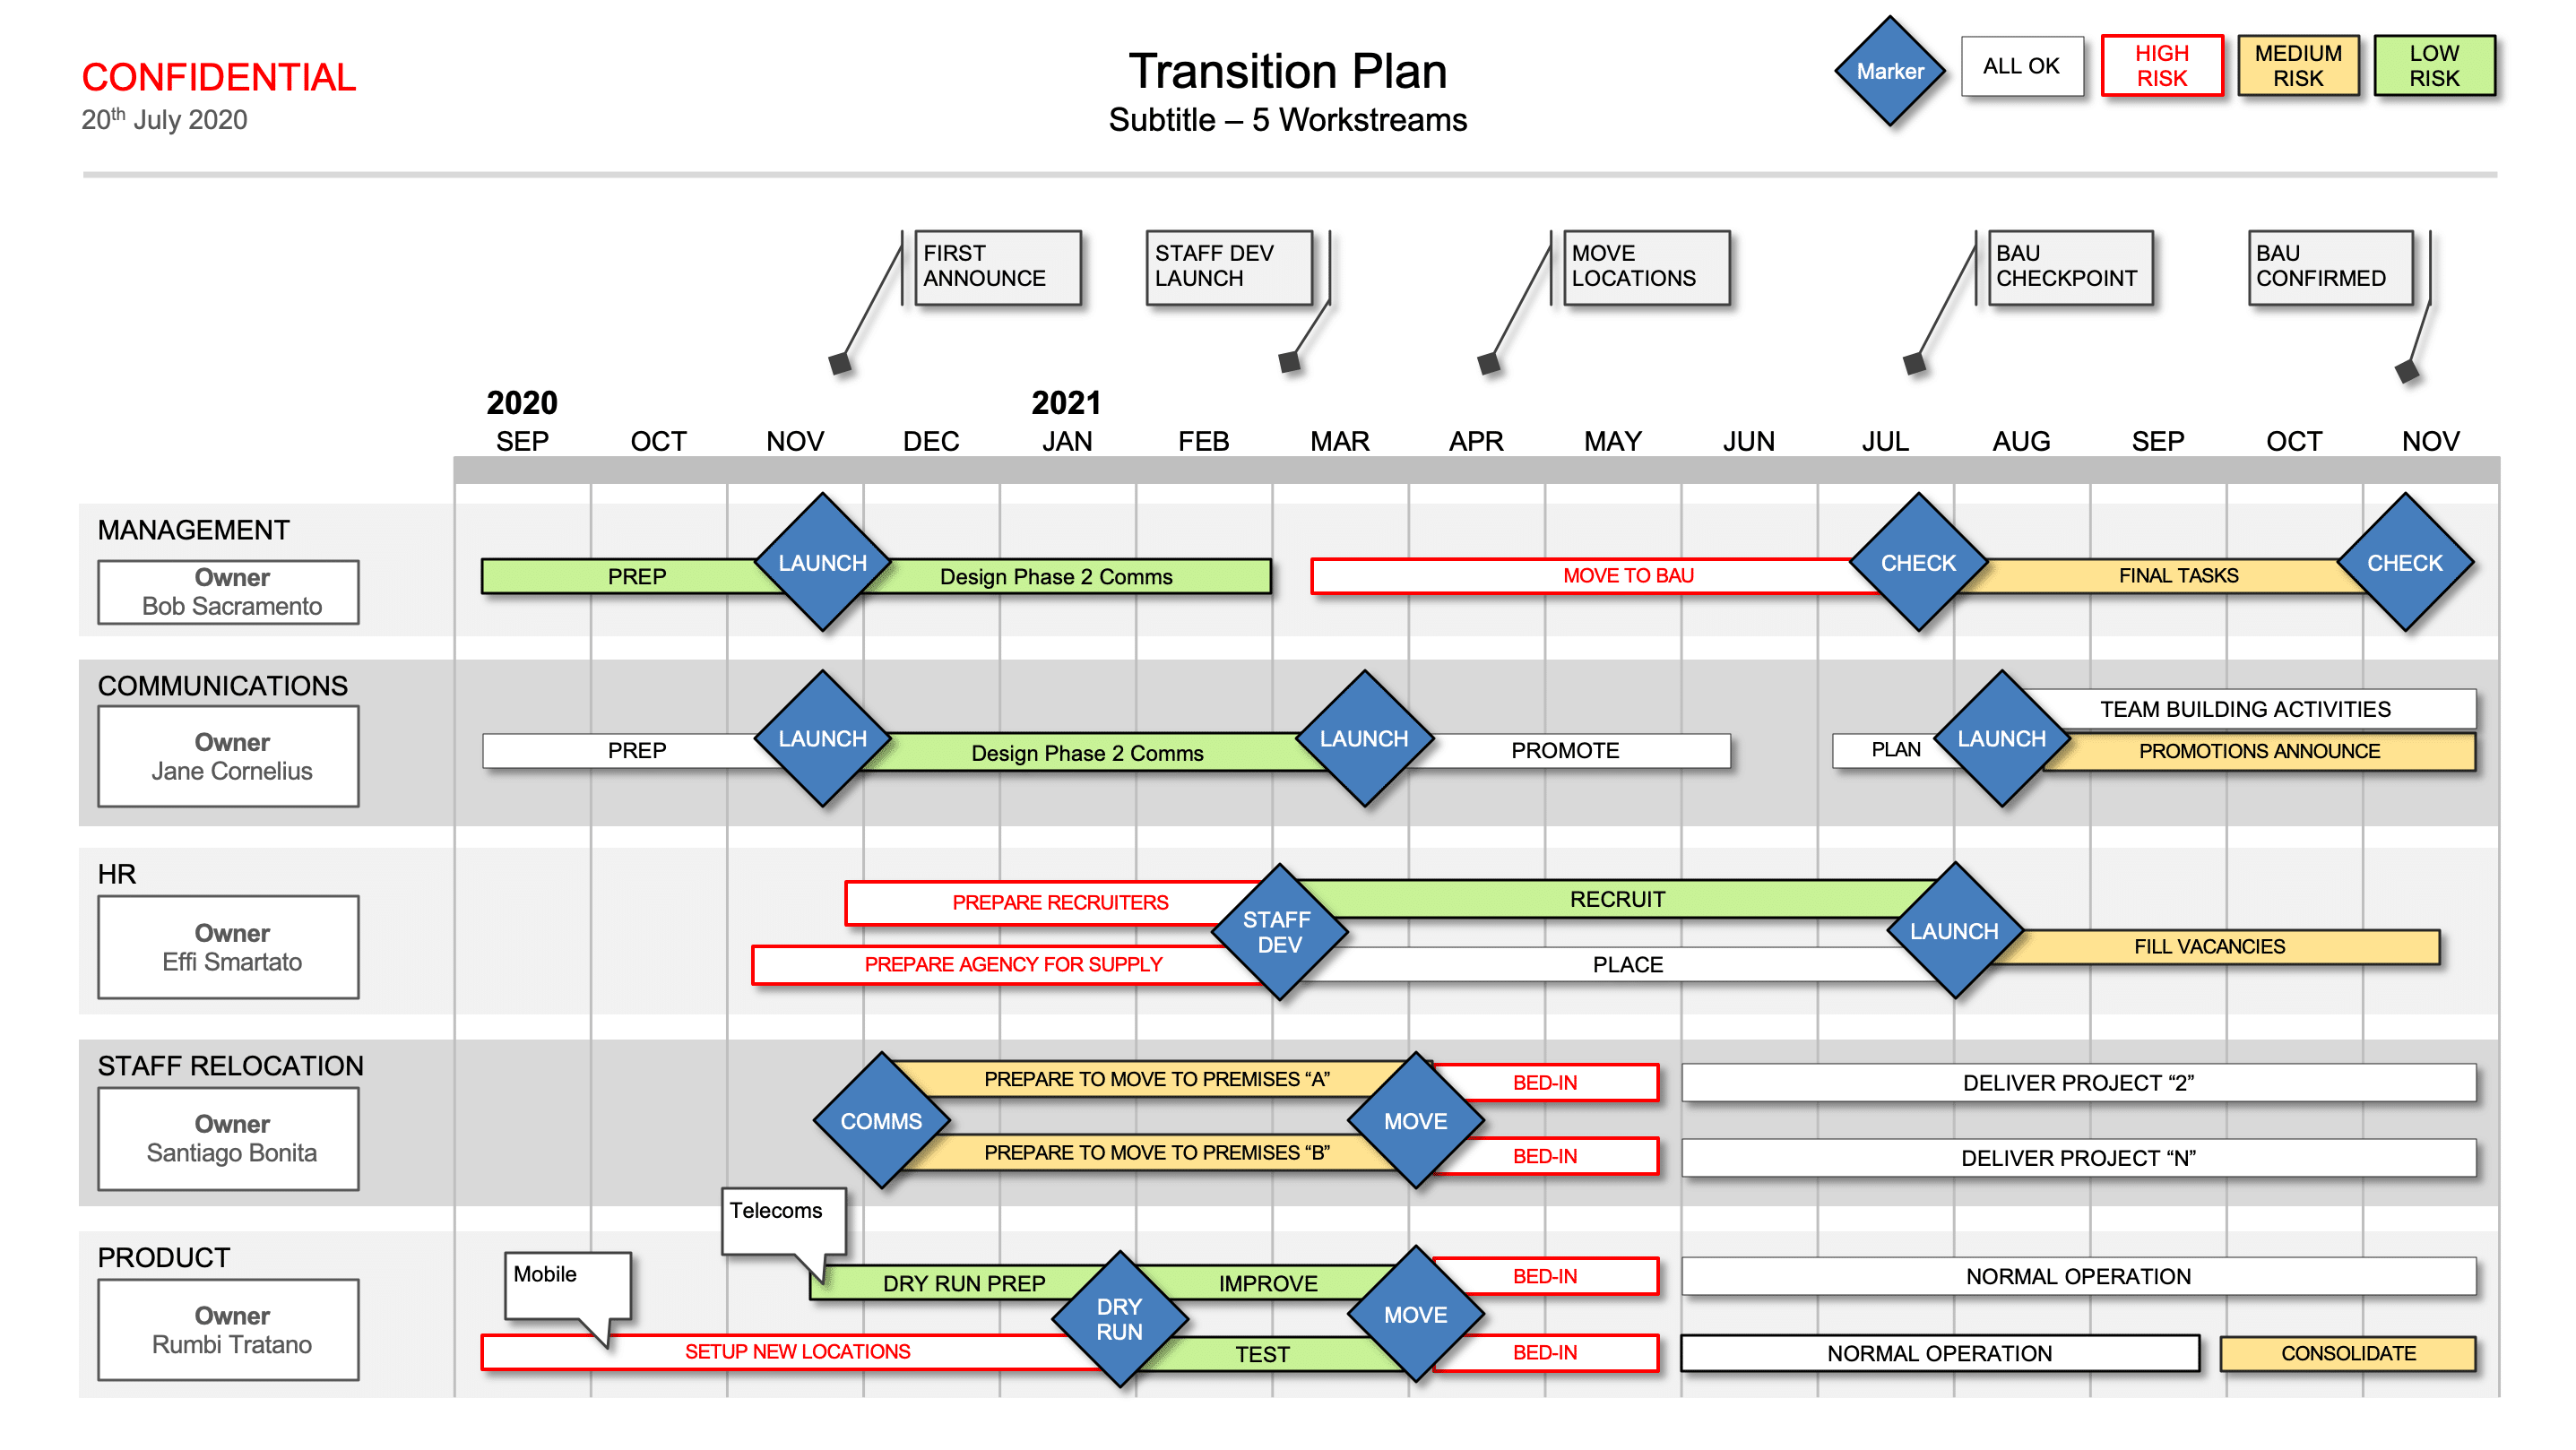
Some examples of Risk levels on a Roadmap
Roadmap Legend
Roadmap project item showing Risk Level within a Workstream
Are you short on time?
Use these templates to help with this Best Practice:

Excel Roadmap Template
A stylish roadmap template in excel format – perfect for adding to existing financial sheets so all your project details are in kept in the same format
See: Excel Roadmap Template")
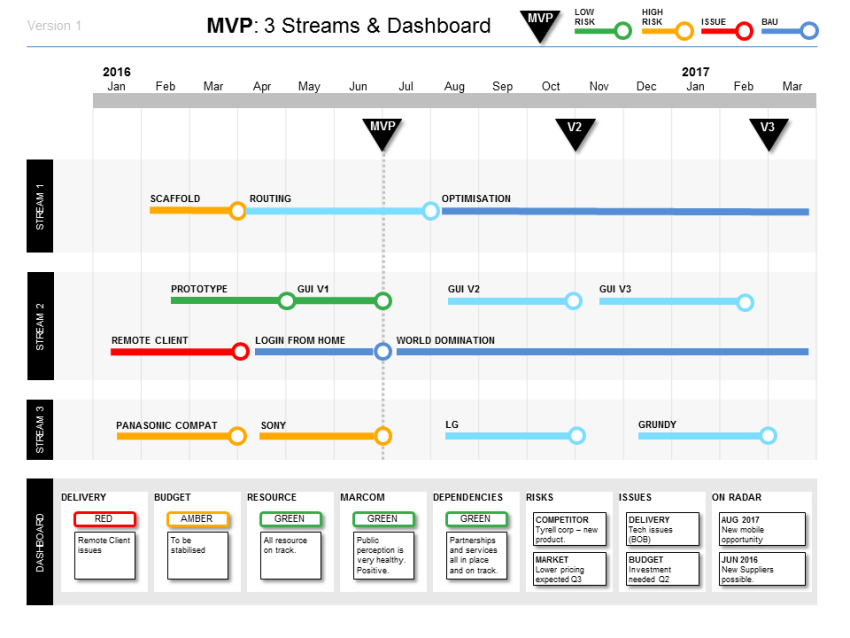
Minimum Viable Product Template – MVP (Powerpoint)
This Minimum Viable Product template includes 5 well-tested formats that will communicate your product’s prioritised launch feature list – your “MVP”.
See: Minimum Viable Product Template – MVP (Powerpoint)
Simple Powerpoint Product Roadmap Template
This Simple Product Roadmap Template makes three of our most popular modern format Powerpoint slides available for a discount price.
See: Simple Powerpoint Product Roadmap Template
RAG Status Template PowerPoint
The RAG Status Template provides a range of RAG formats so that you can communicate project risk levels – Red, Amber, Green – quickly and easily.
See: RAG Status Template PowerPointBusiness Topics that support this Best Practice
RAG Status Reports & Dashboards
RAG Status Template PowerPoint
The RAG Status Template provides a range of RAG formats so that you can communicate project risk levels – Red, Amber, Green – quickly and easily.
See: RAG Status Template PowerPoint")
Project Status Report Template Discount Bundle (PPT & Excel)
All of our Project Status Report Template formats in one discount package. Enjoy our professional formats for delivery status, risk status, rollout status, and innovation status. All in easy-to-edit Powerpoint and Excel.
See: Project Status Report Template Discount Bundle (PPT & Excel)
Solution-focused Excel Risk Log with Dashboard Template
This Risk Log template supports a Solution-focused Risk Management strategy by combining a powerful Risk Dashboard with Mitigation Data. Show HOW and WHEN your risks will be mitigated, and WHO owns them.
See: Solution-focused Excel Risk Log with Dashboard Template")
Dashboard Report (Powerpoint)
A dashboard report powerpoint perfect for updating key stakeholders on projects against delivery, including overall summary, RAG, Risk, SWOT, Dials, Highlights and a Roadmap.
See: Dashboard Report (Powerpoint)Template and Guide Aspects that support this Best Practice
Powerpoint Roadmaps


Dynamic Template Elements - Controlled by Data
")


Risk Log Templates and Dashboard Formats
Risk Log and Transition Management Template Deal (PPT & Excel)
See: Risk Log and Transition Management Template Deal (PPT & Excel)")


")
Templates and Best Practice in this Business Ecosystem

Operations
Operations is a key function in any business. Led by the COO, operations can cover a wide range of business-critical processes.
See: Operations")
New Product Development (NPD)
Templates and guides to create a lean business plan, a release plan for your MVP, then launch your product to market & amaze your customers.
See: New Product Development (NPD)