Posted on

Gantt Chart Excel

Gantt Chart Excel

Using project management software to create Gantt charts gives you more trouble than it is worth. Instead, you should use MS Excel to create your plans, and you will have increased flexibility and speed. Here’s why.

Creating your project gantt chart is not an easy task.

Firstly, using project management software to create gantt charts requires knowledge and experience with the software.

Secondly, in order to create the gantt chart you are required to enter data, and to group the tasks in certain ways.

Finally, fitting the gantt chart on a one side of paper, or on one presentation slide, with everything legible is a challenge! The formatting is often constrained by the software, and you don’t have control over the emphasis of different project elements.

The Gantt chart can take you hours, especially if you are new to MS Project.

Getting all of this together in time for your presentation can be arduous!

This is the reason why we created an easy to use Excel template for creating project gantt charts with Microsoft Excel. You will be able to create your schedule in minutes without any need of learning how to deal with MS Project software.

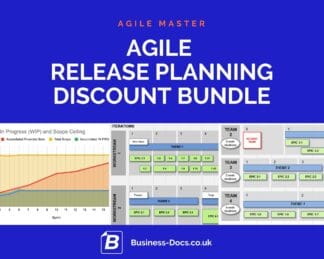
Solution: Use Excel to make a Gantt rapidly

Our Gantt Chart Excel template will help you make the most beautiful gantt chart for your projects in just minutes. It’s so simple that it doesn’t require any special training or skills! Just add the template to our shopping cart, checkout securely, download, and enter the data from your project plan sheet into our spreadsheet and see how amazing it looks at once! By using our Gantt Chart Excel template, creating visually appealing schedules has never been easier. Try now – this format is used by professionals around the world!

Some Gantt FAQs

What are the problems with MS Project Gantt Charts?

1. You have to learn how to use MS Project.
2. They take a long time to create.
3. They can be complex to read.
4. You have limited control over layout and emphasis.

What makes a good Gantt Chart?

1. It has clear timeline.
2. It is easily legible, including only the important task bars.
3. It fits on one A4 side / on one slide.
4. It shows only the important milestones.

What is the fastest way to create impressive Gantt Charts?

The fastest way is to use an Excel template to create a Gantt chart. While MS Project is often used, this requires learning how to use the software, and accurate data entry.

What are the benefits of an Excel Gantt Chart?

1. You can create it with simple Excel editing tools.
2. You have full control of the visual emphasis of different project elements.
3. You can mix Agile and Waterfall sequences and approaches.
4. You do not need to enter lots of data to build the chart.

How do you mix Agile and Waterfall project management on a Gantt Plan?

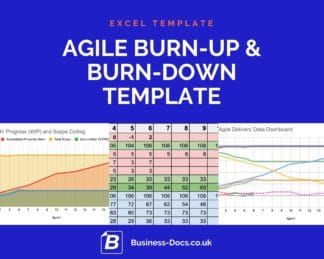
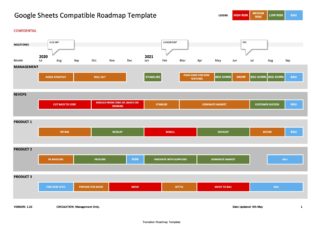
Using an Excel Gantt Chart, you can show a mixture of sequential and continuous project delivery processes. Rows can be shown as continuous task bars, and you can even write “Agile iterations” and show regular breaks inside a task bar.

Posted on

The FROST Innovation Framework for in-house Innovation Programmes

FROST Innovation Framework for in-house Innovation Programmes

A little heads-up – we’re starting on a new range of templates as part of the FROST Innovation Framework from GAS LABS.

This is a useful new framework that supports medium-to-large organisations in creating productive and strategic in-house innovation capabilities.

The FROST Innovation Framework is structured around five key characteristics:

  1. Focused – You articulate the challenge using the “How might we … ?” question template.
  2. Regular – You ensure that the innovation sessions are regular, recurring, and are protected against “emergencies”.
  3. Open – You ensure that the challenge is open, unrestricted, and importantly has no implementation details stipulated.
  4. Safe – Your staff and all participants, really do honestly feel safe to take risks, and to try anything they want to.
  5. Tangible – The outputs must be working prototypes of some form (NOT just pictures or people waving their arms).
Posted on Leave a comment

Managing Stakeholders in Agile Projects

Managing Stakeholders in Agile Projects can be tough in large or old organisations. Have you heard this: “YES. We are agile. But you must tell me what I will get and when!” It’s painful.

The natural tension between Agile and Senior Stakeholder Structures

Upper management in large organisations and Programme Management structures (e.g. PMO) have a natural conflict of interests (or ‘tension’) with agile principles – i.e.

  1. Management and PMO want details on what is going to be delivered and when – i.e. Definition Up Front! – and
  2. The Agile product delivery team want to adapt and change dates and features as & when the customer/audience change – i.e. Definition When it’s NEEDED!

Addressing the tension – how to run Agile in large Stakeholder structures

So – how should we approach the comms around an Agile Project / Programme, and stakeholder management?

The Powerpoint Agile Roadmap Dashboard slide shows project status + Roadmap

Clear “Release” / “Goal” Planning

  1. Describe your Releases (i.e. the significant product drops / deliveries) clearly
  2. Provide a clear 1-sider about each release, outlining what the business goals are

Manage expectations with “The Cone of Uncertainty”

  1. For each aspect of the release, clearly define the expected variance of estimates, according to degree of certainty
  2. So, if you have allowed e.g. 2 sprints / iterations for a feature, but do not plan to unpack the user stories until later on, assign an appropriate +/- 40% caveat to the estimation
  3. For more info
    1. see Agile 101’s understanding the cone of uncertainty.
    2. or Wikipedia’s entry on Cone of Uncertainty.

Focus on Epic User Stories / High-level Features

i.e. use High Level Requirements (EPICS / Features / Themes) to define the delivery

  1. Do not break down your Epics / Features into user stories unless:-
    1. They are about to go into iteration, or
    2. They are very high risk or unknown, and you can’t attach any estimation.
  2. So – avoid breaking down the WHOLE delivery into User Stories.
    1. It is in direct conflict with Agile and Lean to invest in definition unless you NEED to.
    2. So – only spend the teams’ time on defining user stories at the point of implementation.
  3. Keep these high level requirements flexible – this gives you agile wiggle room and scope flexibility at the point of implementation.
  4. Estimate the Epics in Story Points or T-Shirt sizes.
    1. See estimation recommendations here from Agile 101.

Keep Progress Clear

  1. Update your stakeholders regularly on where you are with Features / Epics implementation.
  2. Use a simple format (e.g. Release Plan) to explain which workstreams are delivering which features, and when.

Excel RAID Log & Dashboard Template

Run a High-Level RAID Log and reference your Epics

  1. Use a RAID log to speak in Senior Stakeholder ‘lingo’.
  2. Keep this light, and do not go into too much detail.
  3. Update each sprint, or as serious RAID changes emerge.

Leave room to manoeuvre within your Epics

  1. When defining your high level features or “Epics”, keep the scoping high-level.
  2. Be clear and strategic about the scenarios and success criteria.
  3. Assign risk information to your Epics – raise stakeholder awareness of which features are risky / giving issues.
    1. This will enable them to help you prioritise.
    2. In healthy organisations, this provides a diologue in which to descope and reprioritise high level features.

Include High Level “Non Functional Requirements” (NFR s)

  1. Be sure to include any significant NFRs.
  2. e.g. (and not limited to-) :
    1. Ingegration requirements.
    2. Load testing, User testing, Stakeholder Acceptance testing requirements.
    3. Performance testing.
    4. contingency for all of the above.

Communicate Agile Plans to Senior Stakeholders

Here are some reporting formats that you can use to communicate Agile plans to Senior Stakeholders:

Posted on Leave a comment

How to Score Risk Simply – the Risk Matrix

There are many ways to measure and communicate risk – this is just one that we have found useful, and easy to communicate.

The 25 cell “Impact vs Likelihood” Risk Matrix is a popular format used to communicate Risk Scores. It helps you summarise your risks for project reporting.

The Risk Score Heatmap Matrix

This 5 x 5 (25 cell) matrix gives an easy way to associate a “Severity Score” with a Risk. NB you will see a lot of variations on this – so this is just one approach of many that Project Managers can take.

Risk Matrix used in the RAID Log

Each cell in the matrix is a combination of impact and likelihood.

This allows you to group your risks, based on a score, into some Risk Severity groups:

Risk severity scoring

This Risk Scoring approach is used in our RAID LOG template.

An approach to assigning Impact and Likelihood scores

Project Managers use a list of score definitions, to help one another assign and understand the scores for each risk.

Here is an example approach:

ASSIGNING RISK LIKLEHOOD VALUES
Score Title Likelihood % Chance
1 Rare Rare. A very unlikely event. It could happen, but probably never will. Below 5%
2 Unlikely Not expected. Slight possibility.
An improbable sequence of events.
5% – 25%
3 Possible Moderate likelihood. Foreseeable. May have occurred in projects like this before. 25% – 50%
4 Likely Strong possibility. High likelihood.
An easily foreseeable event.
50% – 75%
5 Almost Certain Very likely.
Almost certain without any intervention.
Above 75%
ASSIGNING RISK IMPACT VALUES
Score Title Outcome / Impact / Consequence Cost / Time / Scope
Implications
1 Insignificant The project will have to make some minor changes to scope. Resolvable by management team. Can be managed. Acceptible.
2 Minor Some changes to deliverables.
Outside of Project Tollerances or Contingency.
Adjustment to scope with some impact.
3 Moderate One or more areas likely not to deliver as planned. Descoping required. Significant impact.
4 High Significant descoping required. Major Impact.
5 Extreme Serious failure of project objectives. Disastrous Impact.

Example Guidance for Project Managers according to Risk Severity

GENERAL GUIDANCE ON RISK MANAGEMENT
Extreme Escalate immediately to project authorities.
Include recommendations.
Actively control.
High Manage immediately.
Inform project authorities.
Act on mitigation and ensure you have response plans ready.
Moderate Manage risk and escalate in normal reporting.
Watch carefully for change in exposure.
Low Manage risk.

Problems with Scoring Risks with a Matrix

There are many ways to allocate weighting to risks, and to group severity, with no right or wrong answer. The allocation of severity groupings helps you give summaries to your colleagues, but the groupings you choose will need to vary depending on the project type, size and environment.

See more here on Wikipedia about the problems with Risk Matrices.

Project Managers manage their Risks in a “RAID Log”.

RAID Logs are used by project managers and programme managers to track and manage project risks.

Many projects have 10s and sometimes 100s of Risks to manage, and so it is essential to keep track of severity, status, next steps, and who owns each risk.

RAID is an acronym that stands for

  1. Risks
  2. Assumptions
  3. Issues
  4. Dependencies