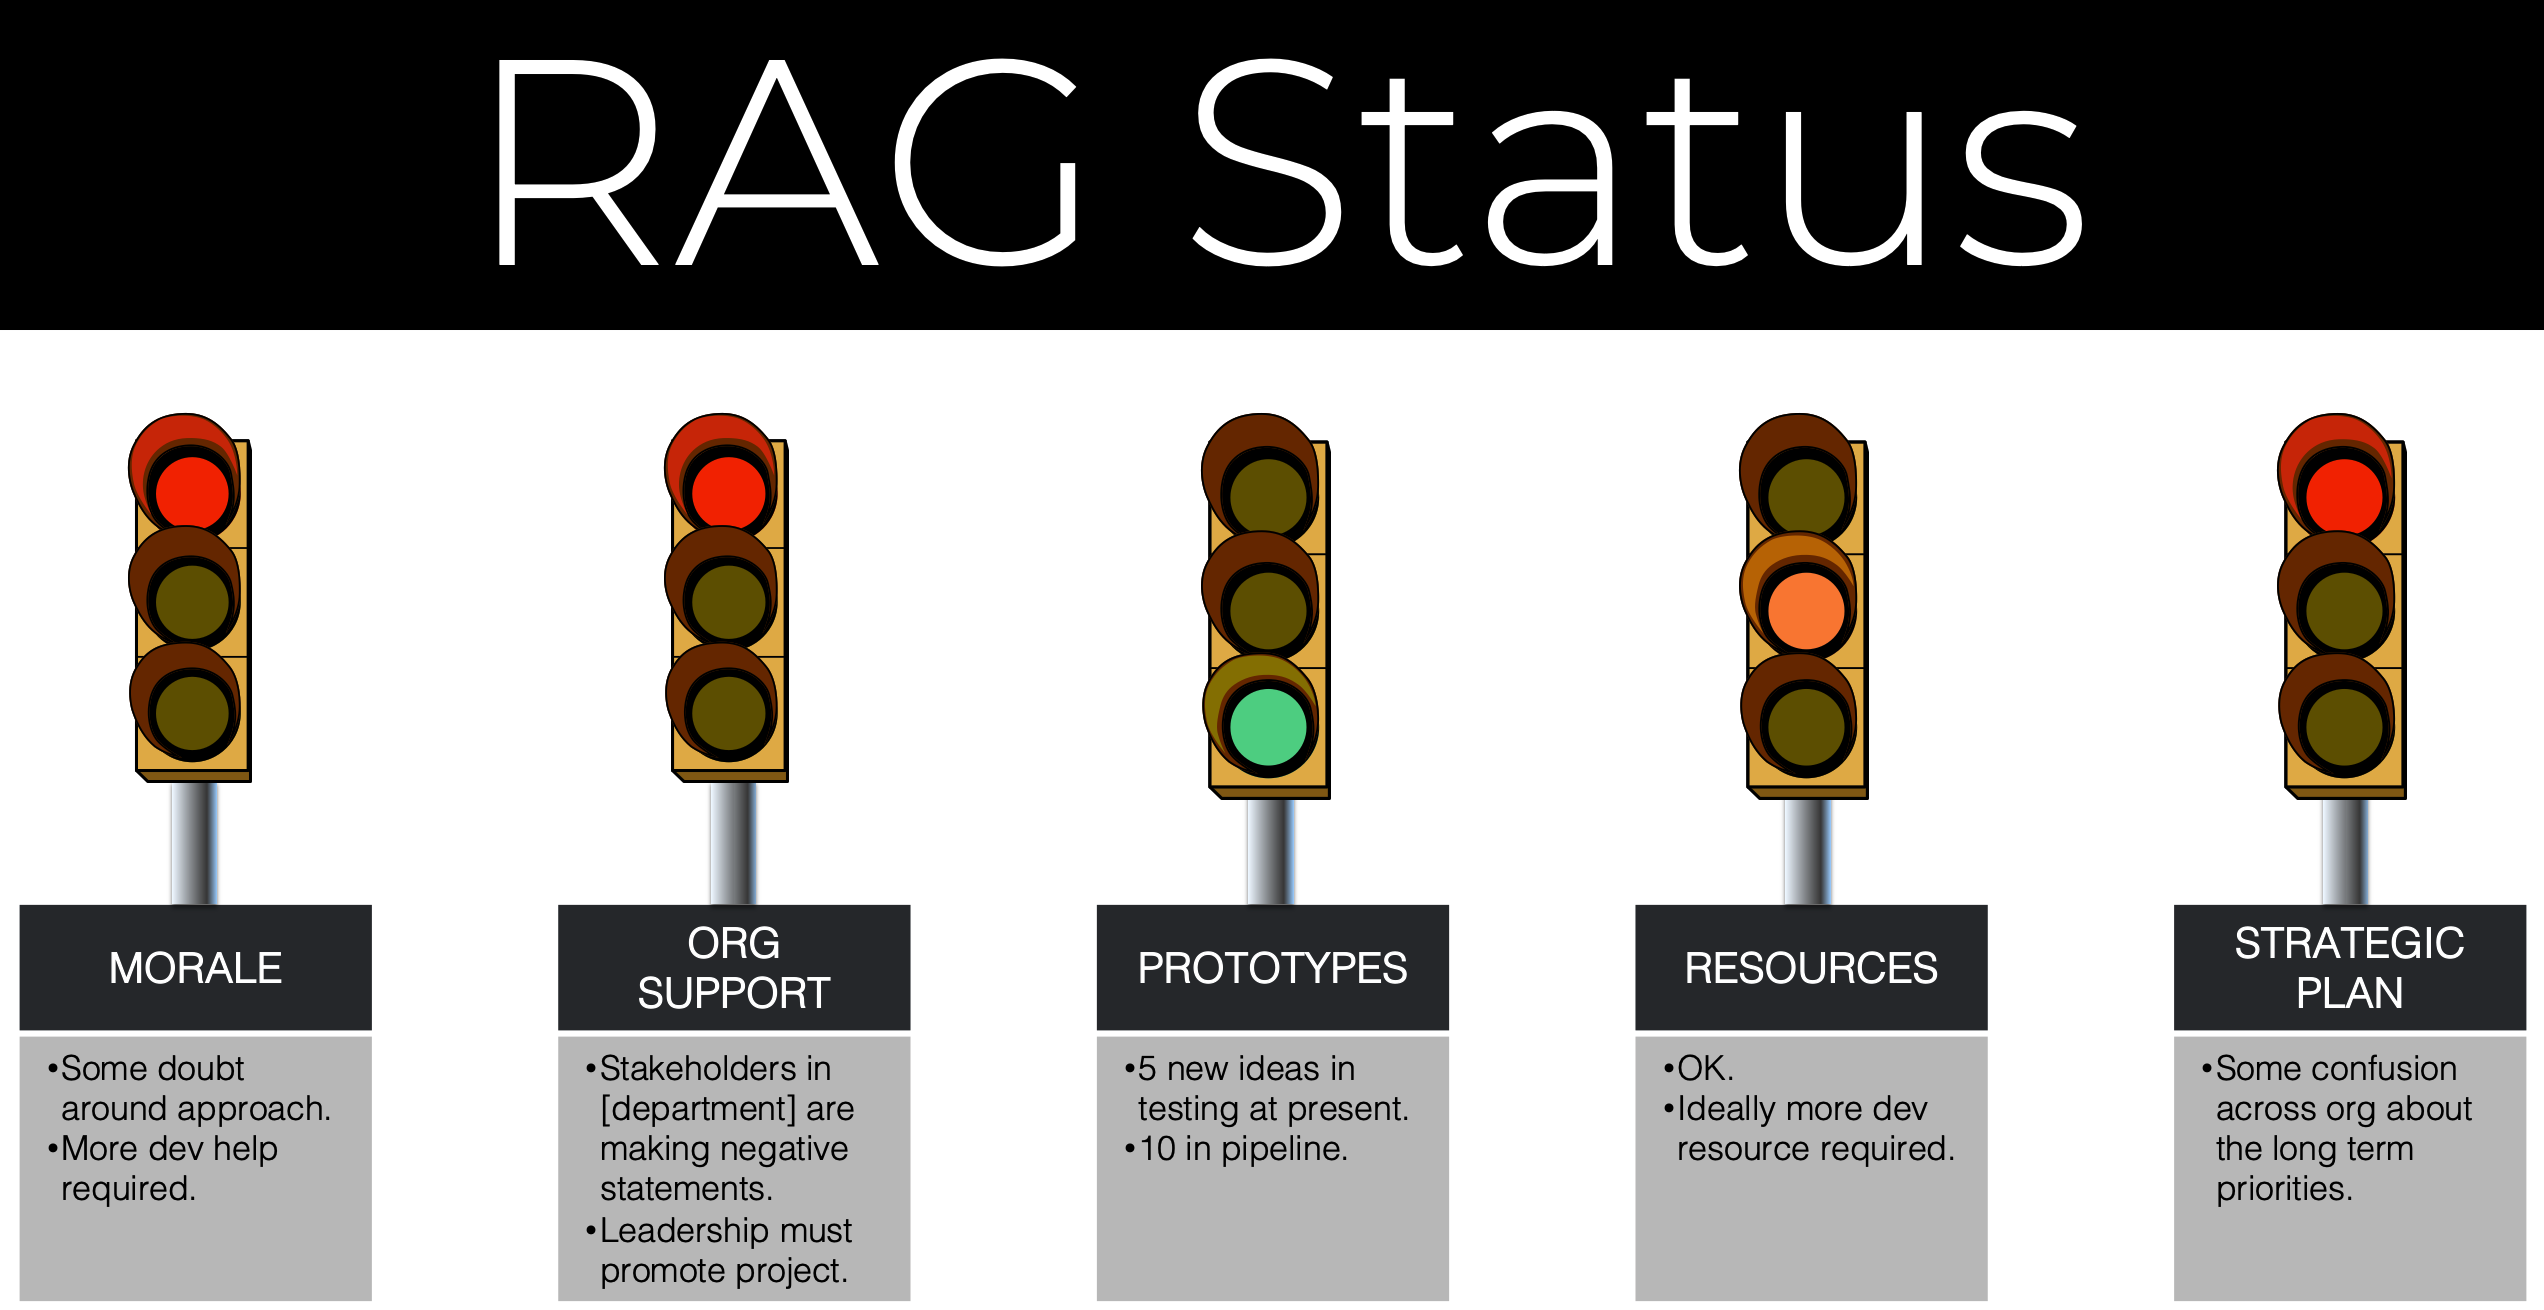
“RAG Status” stands for R / A / G = Red, Amber or Green (it’s an acronym, which means Annoying Manager Word!)
It is commonly used in Project Status reporting to communicate the level of risk.
The Idiots Guide to RAG STATUS
- RED = High Risk
- AMBER = Medium Risk
- GREEN = Low Risk
The Typical RAG Status Conversation
Manager: “What is your RAG status, Mr Smithers?”
You: “I have GREEN for Project Sunshine, and AMBER for Project Saving Rear”
Good – you passed!
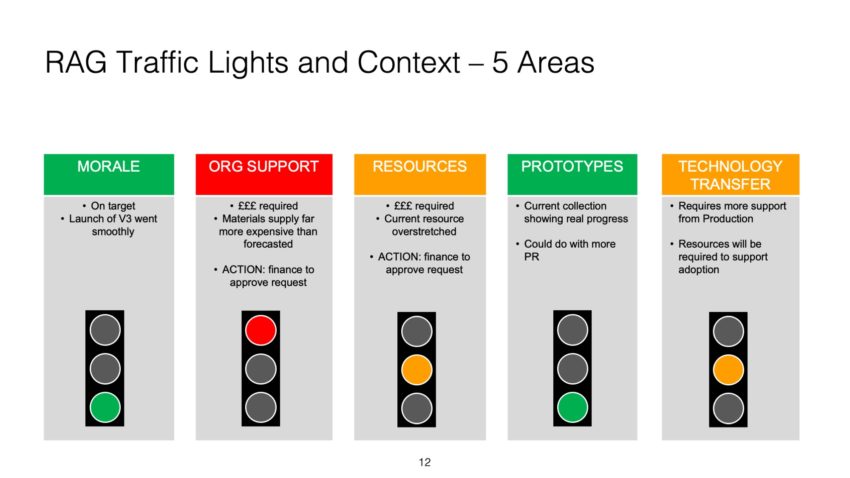
Need more help? Here are a few RAG Status Examples
-
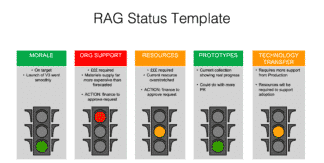 RAG Status Template PowerPoint$ 23.99
 -
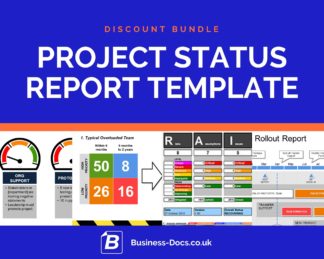 Project Status Report Template Discount Bundle (PPT & Excel)$ 73.49
 -
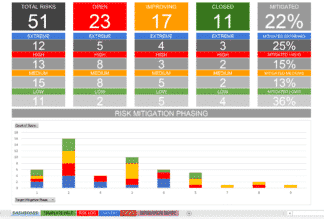 Solution-focused Excel Risk Log with Dashboard Template$ 19.98
 -
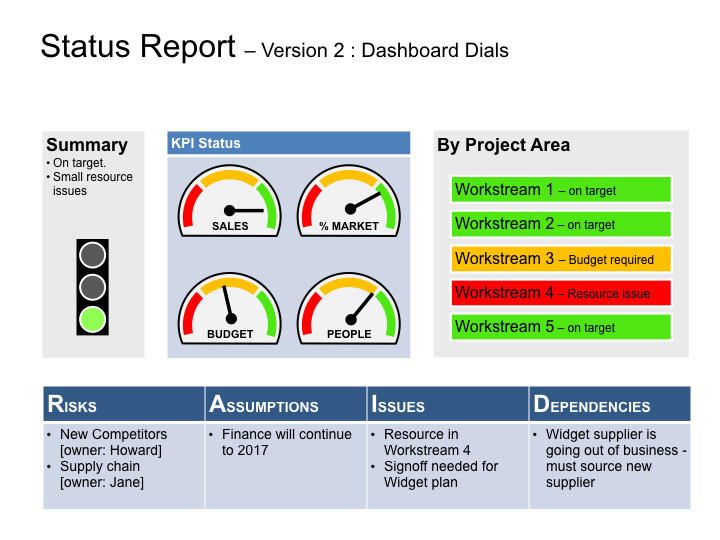
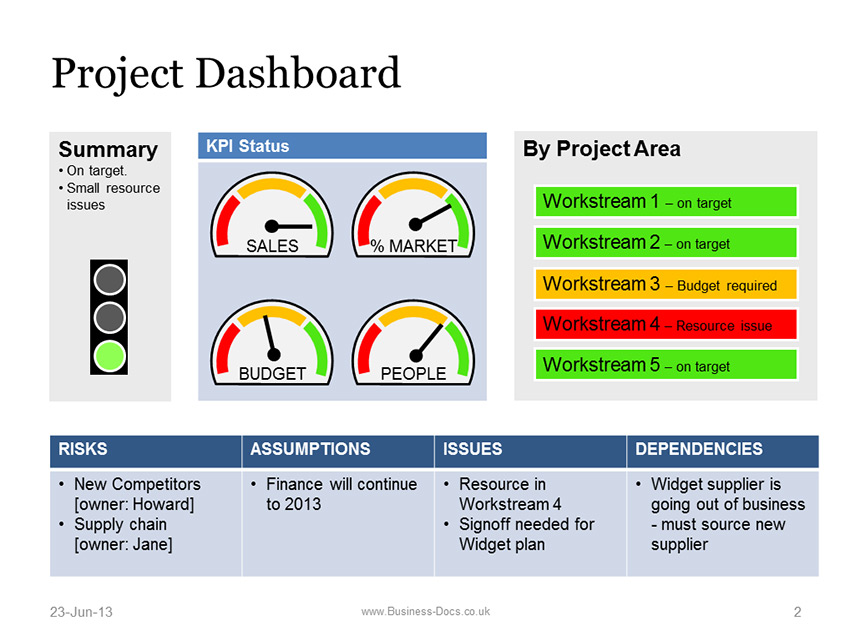
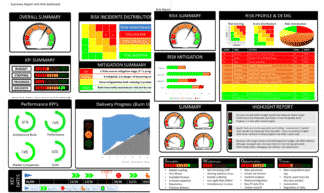 Dashboard Report (Powerpoint)$ 21.99
 -
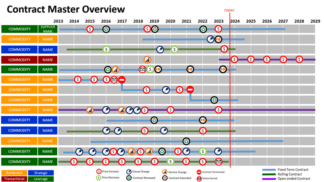 Contract History 2023 (PowerPoint)$ 17.21
 -
 Board Report Template – Keynote$ 19.99
 -
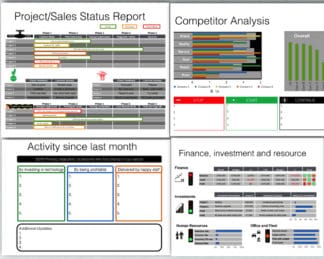
 Market Analysis Presentation$ 19.99
 -
 Board Report Template$ 19.99
 -
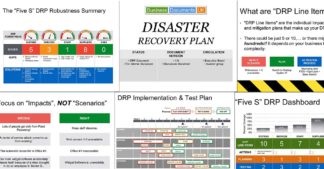
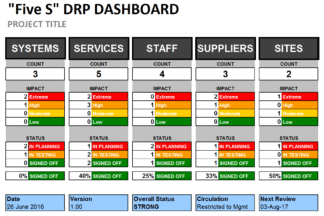
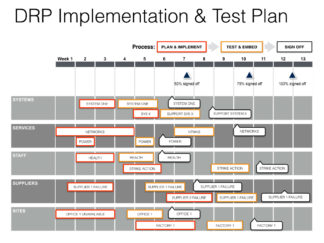 Keynote Disaster Recovery Plan Presentation Template$ 21.97
Watch Out – RAG STATUS can mean different things !!
“Do I need to poke nose in and mess your life up??” Management RAG Status
- RED = Your manager MESSES UP YOUR PROJECT IMMEDIATELY.
- AMBER = Your manager HANGS AROUND ANNOYINGLY.
- GREEN = Your manager reverts to NORMAL PAIN IN THE REAR.
THE TRUTH: Project Manager’s RAG Status
This is what it really means.
- RED = My project is ABOUT TO GO BANG. I am PROTECTING MY ASS.
- AMBER = My project is ABOUT TO GO RED.
- GREEN = My project seems OK, so IT WILL BE AMBER OR RED NEXT WEEK.
MORE JARGON: “Issue Focussed RAG Status”
This will impress your managers. Use these exact words if you want to appear all business-like:
- RED = LIVE ISSUE: remedial action is required to bring the project back within budget or delivery schedule
- AMBER = ISSUE is being addressed: remedial action is in progress, and ISSUE is being addressed
- GREEN = NO LIVE ISSUE: no action required
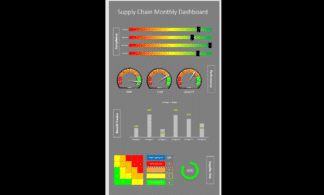
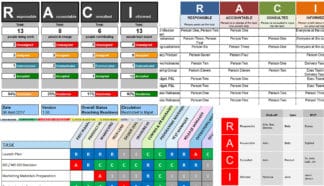
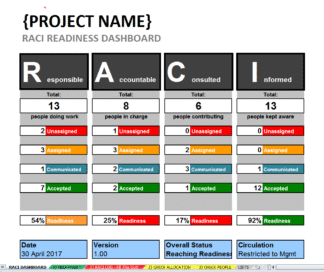
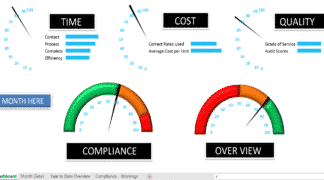
Some more generalised Risk and Status communication formats
Summary – use RAG Status carefully!
RAG Status is a great tool for communicating status quickly, but beware : Make sure you define what the Red, Amber, and Green mean for you and your stakeholders!