Posted on Leave a comment

How to Score Risk Simply – the Risk Matrix

There are many ways to measure and communicate risk – this is just one that we have found useful, and easy to communicate.

The 25 cell “Impact vs Likelihood” Risk Matrix is a popular format used to communicate Risk Scores. It helps you summarise your risks for project reporting.

The Risk Score Heatmap Matrix

This 5 x 5 (25 cell) matrix gives an easy way to associate a “Severity Score” with a Risk. NB you will see a lot of variations on this – so this is just one approach of many that Project Managers can take.

Risk Matrix used in the RAID Log

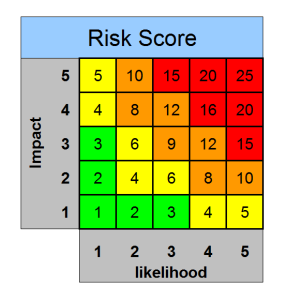
Each cell in the matrix is a combination of impact and likelihood.

This allows you to group your risks, based on a score, into some Risk Severity groups:

Risk severity scoring

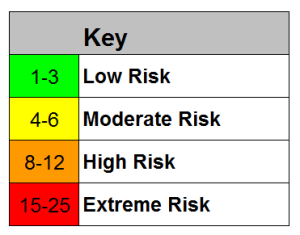
This Risk Scoring approach is used in our RAID LOG template.

An approach to assigning Impact and Likelihood scores

Project Managers use a list of score definitions, to help one another assign and understand the scores for each risk.

Here is an example approach:

ASSIGNING RISK LIKLEHOOD VALUES
Score Title Likelihood % Chance
1 Rare Rare. A very unlikely event. It could happen, but probably never will. Below 5%
2 Unlikely Not expected. Slight possibility.
An improbable sequence of events.
5% – 25%
3 Possible Moderate likelihood. Foreseeable. May have occurred in projects like this before. 25% – 50%
4 Likely Strong possibility. High likelihood.
An easily foreseeable event.
50% – 75%
5 Almost Certain Very likely.
Almost certain without any intervention.
Above 75%
ASSIGNING RISK IMPACT VALUES
Score Title Outcome / Impact / Consequence Cost / Time / Scope
Implications
1 Insignificant The project will have to make some minor changes to scope. Resolvable by management team. Can be managed. Acceptible.
2 Minor Some changes to deliverables.
Outside of Project Tollerances or Contingency.
Adjustment to scope with some impact.
3 Moderate One or more areas likely not to deliver as planned. Descoping required. Significant impact.
4 High Significant descoping required. Major Impact.
5 Extreme Serious failure of project objectives. Disastrous Impact.

Example Guidance for Project Managers according to Risk Severity

GENERAL GUIDANCE ON RISK MANAGEMENT
Extreme Escalate immediately to project authorities.
Include recommendations.
Actively control.
High Manage immediately.
Inform project authorities.
Act on mitigation and ensure you have response plans ready.
Moderate Manage risk and escalate in normal reporting.
Watch carefully for change in exposure.
Low Manage risk.

Problems with Scoring Risks with a Matrix

There are many ways to allocate weighting to risks, and to group severity, with no right or wrong answer. The allocation of severity groupings helps you give summaries to your colleagues, but the groupings you choose will need to vary depending on the project type, size and environment.

See more here on Wikipedia about the problems with Risk Matrices.

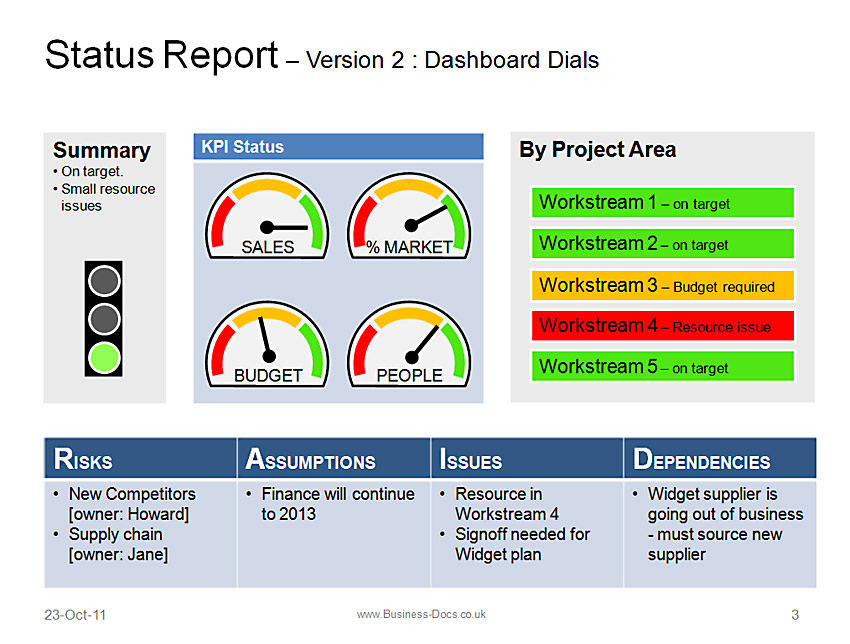
Project Managers manage their Risks in a “RAID Log”.

RAID Logs are used by project managers and programme managers to track and manage project risks.

Many projects have 10s and sometimes 100s of Risks to manage, and so it is essential to keep track of severity, status, next steps, and who owns each risk.

RAID is an acronym that stands for

  1. Risks
  2. Assumptions
  3. Issues
  4. Dependencies
Posted on Leave a comment

Status Report

Status Report with Dashboard

The Status Report is an important Project and Programme -level reporting tool – it should give all the important high-level project information on 1 page.

Status Report Dashboard

This image shows a Status Dashboard Template slide, which can be found in the Status Template pack.

A Status Report Dashboard may literally show some dashboard dials (as this figure shows), or may just be displaying key information, like a conventional dashboard.

The key similarity with a Dashboard is that you can get vital information AT A GLANCE – i.e. ON ONE SIDE.

Status Report Formats

  1. Dashboards
  2. Dashboard Dials
  3. Charts
  4. Agile Burndown
  5. Highlights
  6. RAG – Red Amber Green
  7. RAID
  8. SWOT
  9. Next Steps

Status Report Dials

Some status reports use the “Dial” format (i.e. just like a car dashboard speedometer dial).

Dial formats give a good sense of minimum, maximum, and where our “status” is in that spectrum. This is far better than just a numerical value.

Project Status Report Templates


Posted on Leave a comment

Define your Product Rollout Plan

The Rollout Plan Template - Powerpoint Presentation
The Rollout plan Powerpoint Presentation

Planning your Product Rollout is crucial. You need to design the workstreams, and put project controls in place to be sure your rollout stays on track.

[purchase_link id=”2080″ style=”button” color=”blue” text=”Download the Rollout Plan NOW”]

You can see our ready-made, tried-and-tested Rollout Plan Template here.

How to Plan your Product Rollout

Define “Success” – Your Rollout Objectives & KPIs

  1. What does success look like? – you must document this with measurable success criteria.
  2. Once you have this, you can identify some points in the rollout when you expect to be able to measure the “Performance” of the rollout.
  3. You can record these as Milestones, and as KPIs to focus the team on.

Understand your Risks, Assumptions, Issues and Dependencies

  1. In order to ensure the best possible rollout, you to understand what might affect your success negatively, and manage each of these factors.
  2. In project management terms, this is your RAID log, and includes documenting and managing your:
    1. Risks
    2. Assumptions
    3. Issues
    4. Dependencies
    5. View RAID templates here
  3. Track, mitigate and manage your RAID items through the Rollout process

Define your Phases & Timeline

  1. With the above points in mind, set your timeline for the Rollout.
  2. Base the timeline on a realistic and achievable timescale, and with your RAID items in mind.
  3. If it makes sense to the whole project, split your timeline into Phases, and name them

Define your Milestones

  1. Along with your KPI points, set milestones so that you can monitor project progress
  2. Be sure to get regular Status Updates, and ensure the wider team and stakeholders get Status Reports

Set out your Workstreams & Project Activities

  1. In Agile projects, and in larger Programmes, your team and activities should be arranged in Workstreams
  2. Each Workstream should represent a team, or a particular area of delivery; e.g. “HR”, “DEV”, “CATERING”, “FINANCE”
  3. Plan the project activities, and the KPIs out into these workstreams, along the timeline
  4. Ensure the Workstream participants have contributed, and helped form each workstream plan

Communicate your Rollout Plan!

  1. Agree the Timeline, Workstream, KPI and Activity plans with your team
  2. Create a Rollout Plan Presentation, with your team
  3. Present to all teams and stakeholders
  4. Give your team and Stakeholders Status Reports frequently throughout the Rollout

[purchase_link id=”2080″ style=”button” color=”blue” text=”Download the Rollout Plan NOW”]

Business Documents UK Rollout Templates

[downloads tags=”193″ buy_button=”no” price=”no” number=”12″ order=”ID, DESC” columns=”2″ pagination=false]


Posted on Leave a comment

Project Plan

Powerpoint Project Plan Template

The most effective Project Plan presentations are individually tailored for your audience – one size does not fit all. Browse these plan formats.

Project Plan Template showing a 2 year timeline, workstreams and milestones
An example Project Plan – showing 2 years timeline in a roadmap format; milestones and workstreams

Your Project Plan – Who are you showing it to?

Be very clear about your audience – you will need different project plan approaches for each scenario:

  1. For executive audiences use a Roadmap format to show project plans: Powerpoint Roadmap Template, Visio Roadmap template.
  2. For Product Manager audiences, you should use a Product format: Powerpoint Product Template, Visio Product Template.
  3. To show your product team workstreams what they are doing, use a Project Plan Template format.
  4. For your developers, you should have a release plan, showing activity per iteration.

Some Agile Release Plan Formats


Posted on

RAG Status – Show your Project Status!

Rag Status

“RAG Status” stands for R / A / G = Red, Amber or Green (it’s an acronym, which means Annoying Manager Word!)

RAG status is clearly communicated in this Dashboard template

It is commonly used in Project Status reporting to communicate the level of risk.

The Idiots Guide to RAG STATUS

  1. RED = High Risk
  2. AMBER = Medium Risk
  3. GREEN = Low Risk

The Typical RAG Status Conversation

Manager: “What is your RAG status, Mr Smithers?”

You: “I have GREEN for Project Sunshine, and AMBER for Project Saving Rear”

Good – you passed!

Need more help? Here are a few RAG Status Examples

Watch Out – RAG STATUS can mean different things !!

“Do I need to poke nose in and mess your life up??” Management RAG Status

  1. RED = Your manager MESSES UP YOUR PROJECT IMMEDIATELY.
  2. AMBER = Your manager HANGS AROUND ANNOYINGLY.
  3. GREEN = Your manager reverts to NORMAL PAIN IN THE REAR.

THE TRUTH: Project Manager’s RAG Status

This is what it really means.

  1. RED = My project is ABOUT TO GO BANG. I am PROTECTING MY ASS.
  2. AMBER = My project is ABOUT TO GO RED.
  3. GREEN = My project seems OK, so IT WILL BE AMBER OR RED NEXT WEEK.

MORE JARGON: “Issue Focussed RAG Status”

This will impress your managers. Use these exact words if you want to appear all business-like:

  1. RED = LIVE ISSUE: remedial action is required to bring the project back within budget or delivery schedule
  2. AMBER = ISSUE is being addressed: remedial action is in progress, and ISSUE is being addressed
  3. GREEN = NO LIVE ISSUE: no action required

Some more generalised Risk and Status communication formats

Summary – use RAG Status carefully!

RAG Status is a great tool for communicating status quickly, but beware : Make sure you define what the Red, Amber, and Green mean for you and your stakeholders!

Posted on Leave a comment

Product Plan – define your product!

SWOT PESTLE Roadmap Template (Powerpoint)

This Product Plan format communicates high level Launch Plans, Timeline, Milestones and Objectives to executive board stakeholder groups.

Powerpoint Product Plan with SWOT and PESTLE
Powerpoint Product Plan with SWOT and PESTLE – copyright business-docs.co.uk

The Powerpoint Presentation Product Plan template shown here is based on tried and tested template formats, and is designed to communicate high level product plans to Executive Board audiences.

This Product Plan template is suitable for any stakeholder group circulation.

  1. Executive Summary
  2. Product Plan – roadmap slide
  3. Product SWOT Analysis

The Product Plan Template can be downloaded now, for immediate use.