Posted on

Can your business survive? Top Ten Tips: Ensure your Business Survives Natural Disasters

In the USA disasters force up to 40% of small businesses to cease trading. Can your business survive?… Get the top ten essential preparedness tips here.

Untitled-1

Each year it feels like the UK braces for it’s worst storm in years. In the US hurricanes have repeatedly savaged coastlines and wrecked communities. and the profound consequences of superstorms continue to affect the people and businesses left in their wake.

According to FEMA (U.S. Federal Emergency Management Agency) disasters force up to 40% of small businesses to cease trading, permanently. Smaller companies comprised of 50 employees or less, face a great impact, compared to larger companies with multiple trading sites. Those areas facing existing tough economic trading conditions fare the worst, where the trading conditions were challenging to begin with.

Many businesses take an incredibly long time to reopened. Then there are the additional pressures from increased insurance costs, the decline in tourist numbers and damage to local infrastructure. Many business owners, faced with the additional costs of essentially restarting their business from scratch,  simply give up.

The SRA (U.S. Small Business Administration) calculate that of the estimated   60,000 to 100,000 small businesses that were negatively impacted by hurricanes 30 percent failed as a direct result of the storm.

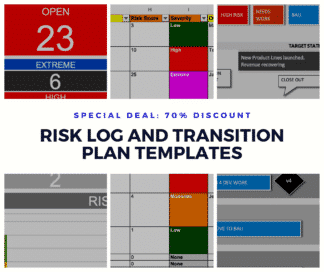
With the inherent risk from such events, how can you protect your business? The answer in one word is preparedness. The more prepared you are, the more likely your business is to survive. The Business Docs top ten essential preparedness tips will help you prepare for the unexpected:

  1.  Check your insurance cover.  This is a bit of a no-brainer but how many of us actually read insurance documents? Thoroughly check that you have all the cover you need, that the policies are in force and there are no hidden policy conditions, which might cause problems if you need to make a claim. Arrange a meeting with your broker to ensure your insurance meets your needs as a business.
  2.  Think beyond natural disaster. We often imagine a disaster to be a hurricane or earthquake. However, a comprehensive threat assessment should include other potential threats, including drought, burglary, power outages, terrorism, cyber attack, or any other events which pose a substantial threat to your business.
  3. Have a comprehensive BCP (Business Continuity Plan). A comprehensive BCP is essential in ensuring that your business can be reinstated as soon as possible following an event. Working out what to do before an event occurs, ensures that you maintain control of your business.
  4. Make sure employees know what to and stay safe. As a business owner, if a disaster occurs your first priority is to ensure the safety of your customers and employees. If employees know what to do and how to handle the situation, they can take effective control and ensure the safety of all involved.
  5. Carry a copy of your business continuity plan with you. A disaster can happen at any time, ensure that you have access to your plan at all times by keeping it with you.
  6. Keep the contact details for your employees up to date. Staying in contact with your employees in a business continuity event is crucial. Ensure that you have the current contact details for all your employees. Check with all your employees once a month to ensure their details is current.
  7. Have an alternate site or recovery work area for your business. Many businesses are reliant upon a single site that their business operates from. If that site is destroyed or rendered inoperative, consider how your business would survive. Alternate sites or recovery work areas can be rented for your business to move into immediately if your usual site cannot be used.
  8. Have a strategy. Having a plan is additional work and expense that you might never need. However, if the worst were to happen, you would be thankful you planned ahead.
  9. Stay in contact and have your business equipment available. If a disaster were to occur, the last thing you need to have happen is not to have essential business equipment with you. Keep your company cell phone, laptop, tablets, tool kits, medical kits and anything else that you might need with you. Ensure employees do the same, so you can stay in communication with them and they have the essential equipment at hand.
  10. Inform your customers. In all of this, don’t forget your customers. Informing your customers that you have comprehensive continuity plans, displays due diligence and commitment towards them. If a business continuity event occurs, contact your customers and keep them reassured.

We can help you!

  1. Disaster Recovery Plan Template
  2. Business Continuity Plan
  3. RAID Log
  4. Project Dashboard
  5. Roll-out Plan
Posted on Leave a comment

Managing Stakeholders in Agile Projects

Managing Stakeholders in Agile Projects can be tough in large or old organisations. Have you heard this: “YES. We are agile. But you must tell me what I will get and when!” It’s painful.

The natural tension between Agile and Senior Stakeholder Structures

Upper management in large organisations and Programme Management structures (e.g. PMO) have a natural conflict of interests (or ‘tension’) with agile principles – i.e.

  1. Management and PMO want details on what is going to be delivered and when – i.e. Definition Up Front! – and
  2. The Agile product delivery team want to adapt and change dates and features as & when the customer/audience change – i.e. Definition When it’s NEEDED!

Addressing the tension – how to run Agile in large Stakeholder structures

So – how should we approach the comms around an Agile Project / Programme, and stakeholder management?

The Powerpoint Agile Roadmap Dashboard slide shows project status + Roadmap

Clear “Release” / “Goal” Planning

  1. Describe your Releases (i.e. the significant product drops / deliveries) clearly
  2. Provide a clear 1-sider about each release, outlining what the business goals are

Manage expectations with “The Cone of Uncertainty”

  1. For each aspect of the release, clearly define the expected variance of estimates, according to degree of certainty
  2. So, if you have allowed e.g. 2 sprints / iterations for a feature, but do not plan to unpack the user stories until later on, assign an appropriate +/- 40% caveat to the estimation
  3. For more info
    1. see Agile 101’s understanding the cone of uncertainty.
    2. or Wikipedia’s entry on Cone of Uncertainty.

Focus on Epic User Stories / High-level Features

i.e. use High Level Requirements (EPICS / Features / Themes) to define the delivery

  1. Do not break down your Epics / Features into user stories unless:-
    1. They are about to go into iteration, or
    2. They are very high risk or unknown, and you can’t attach any estimation.
  2. So – avoid breaking down the WHOLE delivery into User Stories.
    1. It is in direct conflict with Agile and Lean to invest in definition unless you NEED to.
    2. So – only spend the teams’ time on defining user stories at the point of implementation.
  3. Keep these high level requirements flexible – this gives you agile wiggle room and scope flexibility at the point of implementation.
  4. Estimate the Epics in Story Points or T-Shirt sizes.
    1. See estimation recommendations here from Agile 101.

Keep Progress Clear

  1. Update your stakeholders regularly on where you are with Features / Epics implementation.
  2. Use a simple format (e.g. Release Plan) to explain which workstreams are delivering which features, and when.

Excel RAID Log & Dashboard Template

Run a High-Level RAID Log and reference your Epics

  1. Use a RAID log to speak in Senior Stakeholder ‘lingo’.
  2. Keep this light, and do not go into too much detail.
  3. Update each sprint, or as serious RAID changes emerge.

Leave room to manoeuvre within your Epics

  1. When defining your high level features or “Epics”, keep the scoping high-level.
  2. Be clear and strategic about the scenarios and success criteria.
  3. Assign risk information to your Epics – raise stakeholder awareness of which features are risky / giving issues.
    1. This will enable them to help you prioritise.
    2. In healthy organisations, this provides a diologue in which to descope and reprioritise high level features.

Include High Level “Non Functional Requirements” (NFR s)

  1. Be sure to include any significant NFRs.
  2. e.g. (and not limited to-) :
    1. Ingegration requirements.
    2. Load testing, User testing, Stakeholder Acceptance testing requirements.
    3. Performance testing.
    4. contingency for all of the above.

Communicate Agile Plans to Senior Stakeholders

Here are some reporting formats that you can use to communicate Agile plans to Senior Stakeholders:

Posted on Leave a comment

How to Score Risk Simply – the Risk Matrix

There are many ways to measure and communicate risk – this is just one that we have found useful, and easy to communicate.

The 25 cell “Impact vs Likelihood” Risk Matrix is a popular format used to communicate Risk Scores. It helps you summarise your risks for project reporting.

The Risk Score Heatmap Matrix

This 5 x 5 (25 cell) matrix gives an easy way to associate a “Severity Score” with a Risk. NB you will see a lot of variations on this – so this is just one approach of many that Project Managers can take.

Risk Matrix used in the RAID Log

Each cell in the matrix is a combination of impact and likelihood.

This allows you to group your risks, based on a score, into some Risk Severity groups:

Risk severity scoring

This Risk Scoring approach is used in our RAID LOG template.

An approach to assigning Impact and Likelihood scores

Project Managers use a list of score definitions, to help one another assign and understand the scores for each risk.

Here is an example approach:

ASSIGNING RISK LIKLEHOOD VALUES
Score Title Likelihood % Chance
1 Rare Rare. A very unlikely event. It could happen, but probably never will. Below 5%
2 Unlikely Not expected. Slight possibility.
An improbable sequence of events.
5% – 25%
3 Possible Moderate likelihood. Foreseeable. May have occurred in projects like this before. 25% – 50%
4 Likely Strong possibility. High likelihood.
An easily foreseeable event.
50% – 75%
5 Almost Certain Very likely.
Almost certain without any intervention.
Above 75%
ASSIGNING RISK IMPACT VALUES
Score Title Outcome / Impact / Consequence Cost / Time / Scope
Implications
1 Insignificant The project will have to make some minor changes to scope. Resolvable by management team. Can be managed. Acceptible.
2 Minor Some changes to deliverables.
Outside of Project Tollerances or Contingency.
Adjustment to scope with some impact.
3 Moderate One or more areas likely not to deliver as planned. Descoping required. Significant impact.
4 High Significant descoping required. Major Impact.
5 Extreme Serious failure of project objectives. Disastrous Impact.

Example Guidance for Project Managers according to Risk Severity

GENERAL GUIDANCE ON RISK MANAGEMENT
Extreme Escalate immediately to project authorities.
Include recommendations.
Actively control.
High Manage immediately.
Inform project authorities.
Act on mitigation and ensure you have response plans ready.
Moderate Manage risk and escalate in normal reporting.
Watch carefully for change in exposure.
Low Manage risk.

Problems with Scoring Risks with a Matrix

There are many ways to allocate weighting to risks, and to group severity, with no right or wrong answer. The allocation of severity groupings helps you give summaries to your colleagues, but the groupings you choose will need to vary depending on the project type, size and environment.

See more here on Wikipedia about the problems with Risk Matrices.

Project Managers manage their Risks in a “RAID Log”.

RAID Logs are used by project managers and programme managers to track and manage project risks.

Many projects have 10s and sometimes 100s of Risks to manage, and so it is essential to keep track of severity, status, next steps, and who owns each risk.

RAID is an acronym that stands for

  1. Risks
  2. Assumptions
  3. Issues
  4. Dependencies
Posted on Leave a comment

Status Report

Status Report with Dashboard

The Status Report is an important Project and Programme -level reporting tool – it should give all the important high-level project information on 1 page.

Status Report Dashboard

This image shows a Status Dashboard Template slide, which can be found in the Status Template pack.

A Status Report Dashboard may literally show some dashboard dials (as this figure shows), or may just be displaying key information, like a conventional dashboard.

The key similarity with a Dashboard is that you can get vital information AT A GLANCE – i.e. ON ONE SIDE.

Status Report Formats

  1. Dashboards
  2. Dashboard Dials
  3. Charts
  4. Agile Burndown
  5. Highlights
  6. RAG – Red Amber Green
  7. RAID
  8. SWOT
  9. Next Steps

Status Report Dials

Some status reports use the “Dial” format (i.e. just like a car dashboard speedometer dial).

Dial formats give a good sense of minimum, maximum, and where our “status” is in that spectrum. This is far better than just a numerical value.

Project Status Report Templates


Posted on Leave a comment

Define your Product Rollout Plan

The Rollout Plan Template - Powerpoint Presentation
The Rollout plan Powerpoint Presentation

Planning your Product Rollout is crucial. You need to design the workstreams, and put project controls in place to be sure your rollout stays on track.

[purchase_link id=”2080″ style=”button” color=”blue” text=”Download the Rollout Plan NOW”]

You can see our ready-made, tried-and-tested Rollout Plan Template here.

How to Plan your Product Rollout

Define “Success” – Your Rollout Objectives & KPIs

  1. What does success look like? – you must document this with measurable success criteria.
  2. Once you have this, you can identify some points in the rollout when you expect to be able to measure the “Performance” of the rollout.
  3. You can record these as Milestones, and as KPIs to focus the team on.

Understand your Risks, Assumptions, Issues and Dependencies

  1. In order to ensure the best possible rollout, you to understand what might affect your success negatively, and manage each of these factors.
  2. In project management terms, this is your RAID log, and includes documenting and managing your:
    1. Risks
    2. Assumptions
    3. Issues
    4. Dependencies
    5. View RAID templates here
  3. Track, mitigate and manage your RAID items through the Rollout process

Define your Phases & Timeline

  1. With the above points in mind, set your timeline for the Rollout.
  2. Base the timeline on a realistic and achievable timescale, and with your RAID items in mind.
  3. If it makes sense to the whole project, split your timeline into Phases, and name them

Define your Milestones

  1. Along with your KPI points, set milestones so that you can monitor project progress
  2. Be sure to get regular Status Updates, and ensure the wider team and stakeholders get Status Reports

Set out your Workstreams & Project Activities

  1. In Agile projects, and in larger Programmes, your team and activities should be arranged in Workstreams
  2. Each Workstream should represent a team, or a particular area of delivery; e.g. “HR”, “DEV”, “CATERING”, “FINANCE”
  3. Plan the project activities, and the KPIs out into these workstreams, along the timeline
  4. Ensure the Workstream participants have contributed, and helped form each workstream plan

Communicate your Rollout Plan!

  1. Agree the Timeline, Workstream, KPI and Activity plans with your team
  2. Create a Rollout Plan Presentation, with your team
  3. Present to all teams and stakeholders
  4. Give your team and Stakeholders Status Reports frequently throughout the Rollout

[purchase_link id=”2080″ style=”button” color=”blue” text=”Download the Rollout Plan NOW”]

Business Documents UK Rollout Templates

[downloads tags=”193″ buy_button=”no” price=”no” number=”12″ order=”ID, DESC” columns=”2″ pagination=false]


Posted on Leave a comment

RAID Log – Manage Project Risk

Risk Matrix used in the RAID Log

A RAID Log is a great tool for managing Project Risk.

RAID stands for Risks, Assumptions, Issues, Dependencies.

BEWARE – it is hard to keep track of these aspects of your project in your head. You can keep track of them using a LOG TEMPLATE for your own safety.

Risks (R in RAID)

Your project risks are the “issues waiting to happen”.

i.e. Ask yourself “What could go wrong?”, and the list of items in answer to that are your risks.

e.g. when planning for a race, an example risk could be “My shoes fail during the race”

RISK SHEET - Excel RAID log & Dashboard Template
RISK SHEET – Excel RAID log & Dashboard Template

Assumptions (A in RAID)

Assumptions are items that you believe to be fine,… but that may not be. Assumptions are aspects of the environment, or of the surroundings to your project that you believe will be in a certain state.

The purpose of tracking assumptions is that you need to be prepared for your assumptions being wrong.

Issues (I in RAID)

Issues are the things which are actually going wrong – i.e. Risks that have been realised, and have turned into issues.

If you were lucky with your Risks identification earlier, you may already be prepared to deal with the issues 🙂

Dependencies (D in RAID)

Dependencies are items being delivered- or supplied-  from elsewhere, and that may not be directly in your control.

i.e. in order for your project to deliver, your dependencies must be present / delivered / supported.

Dependencies are quite frequently what cause project failure – track these carefully!


Excel RAID Log & Dashboard Template

RAID Log Template

This Excel Template is a handy format which allows you to track your RAID items, their status, and assign them to owners.

Some examples templates in the “Risk” area