Managing Stakeholders in Agile Projects can be tough in large or old organisations. Have you heard this: “YES. We are agile. But you must tell me what I will get and when!” It’s painful.
The natural tension between Agile and Senior Stakeholder Structures
Upper management in large organisations and Programme Management structures (e.g. PMO) have a natural conflict of interests (or ‘tension’) with agile principles – i.e.
- Management and PMO want details on what is going to be delivered and when – i.e. Definition Up Front! – and
- The Agile product delivery team want to adapt and change dates and features as & when the customer/audience change – i.e. Definition When it’s NEEDED!
Addressing the tension – how to run Agile in large Stakeholder structures
So – how should we approach the comms around an Agile Project / Programme, and stakeholder management?

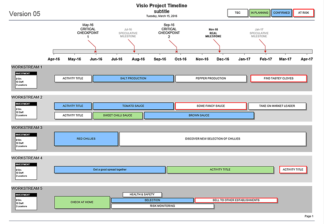
Clear “Release” / “Goal” Planning
- Describe your Releases (i.e. the significant product drops / deliveries) clearly
- Provide a clear 1-sider about each release, outlining what the business goals are
Manage expectations with “The Cone of Uncertainty”
- For each aspect of the release, clearly define the expected variance of estimates, according to degree of certainty
- So, if you have allowed e.g. 2 sprints / iterations for a feature, but do not plan to unpack the user stories until later on, assign an appropriate +/- 40% caveat to the estimation
- For more info
- see Agile 101’s understanding the cone of uncertainty.
- or Wikipedia’s entry on Cone of Uncertainty.
Focus on Epic User Stories / High-level Features
i.e. use High Level Requirements (EPICS / Features / Themes) to define the delivery
- Do not break down your Epics / Features into user stories unless:-
- They are about to go into iteration, or
- They are very high risk or unknown, and you can’t attach any estimation.
- So – avoid breaking down the WHOLE delivery into User Stories.
- It is in direct conflict with Agile and Lean to invest in definition unless you NEED to.
- So – only spend the teams’ time on defining user stories at the point of implementation.
- Keep these high level requirements flexible – this gives you agile wiggle room and scope flexibility at the point of implementation.
- Estimate the Epics in Story Points or T-Shirt sizes.
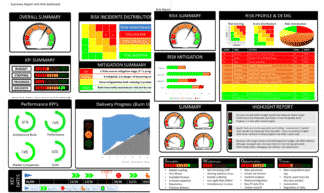
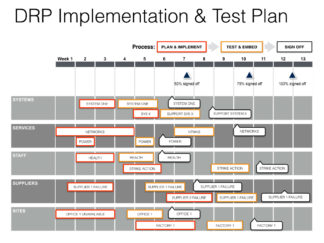
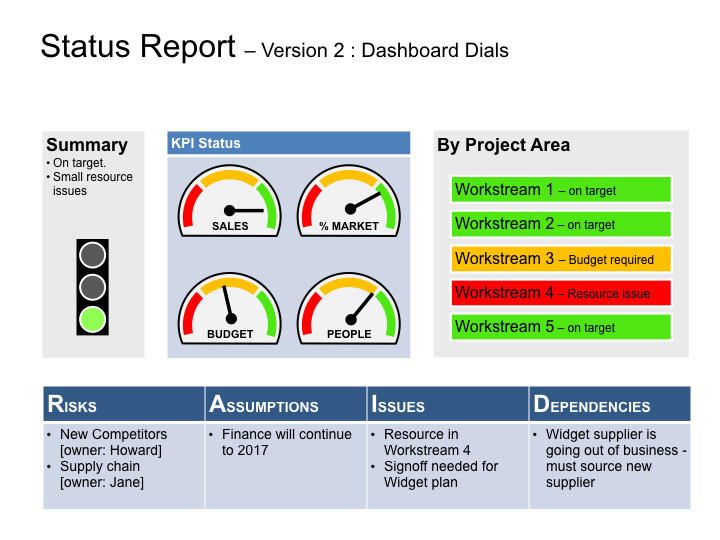
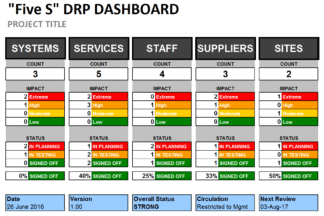
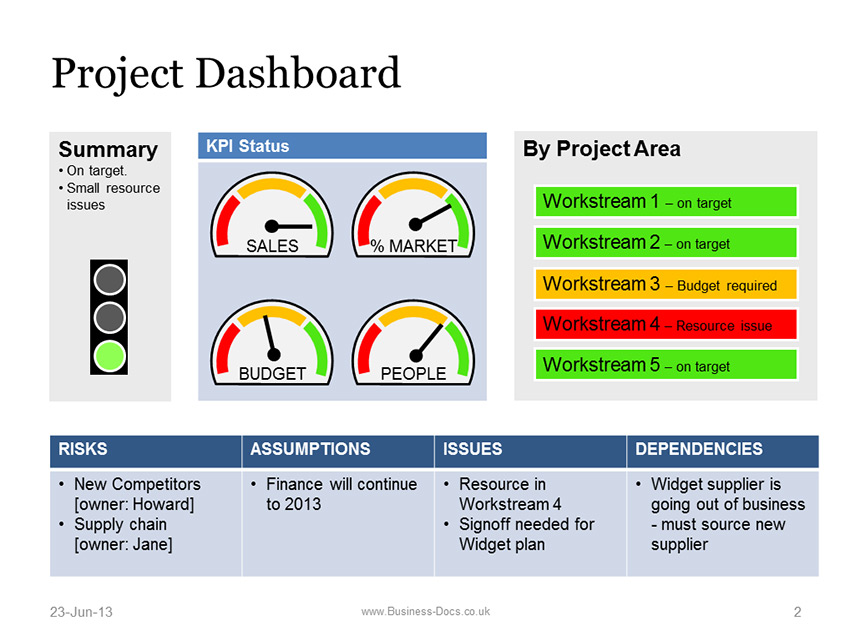
Keep Progress Clear
- Update your stakeholders regularly on where you are with Features / Epics implementation.
- Use a simple format (e.g. Release Plan) to explain which workstreams are delivering which features, and when.

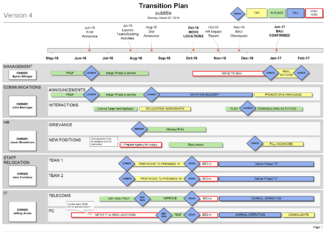
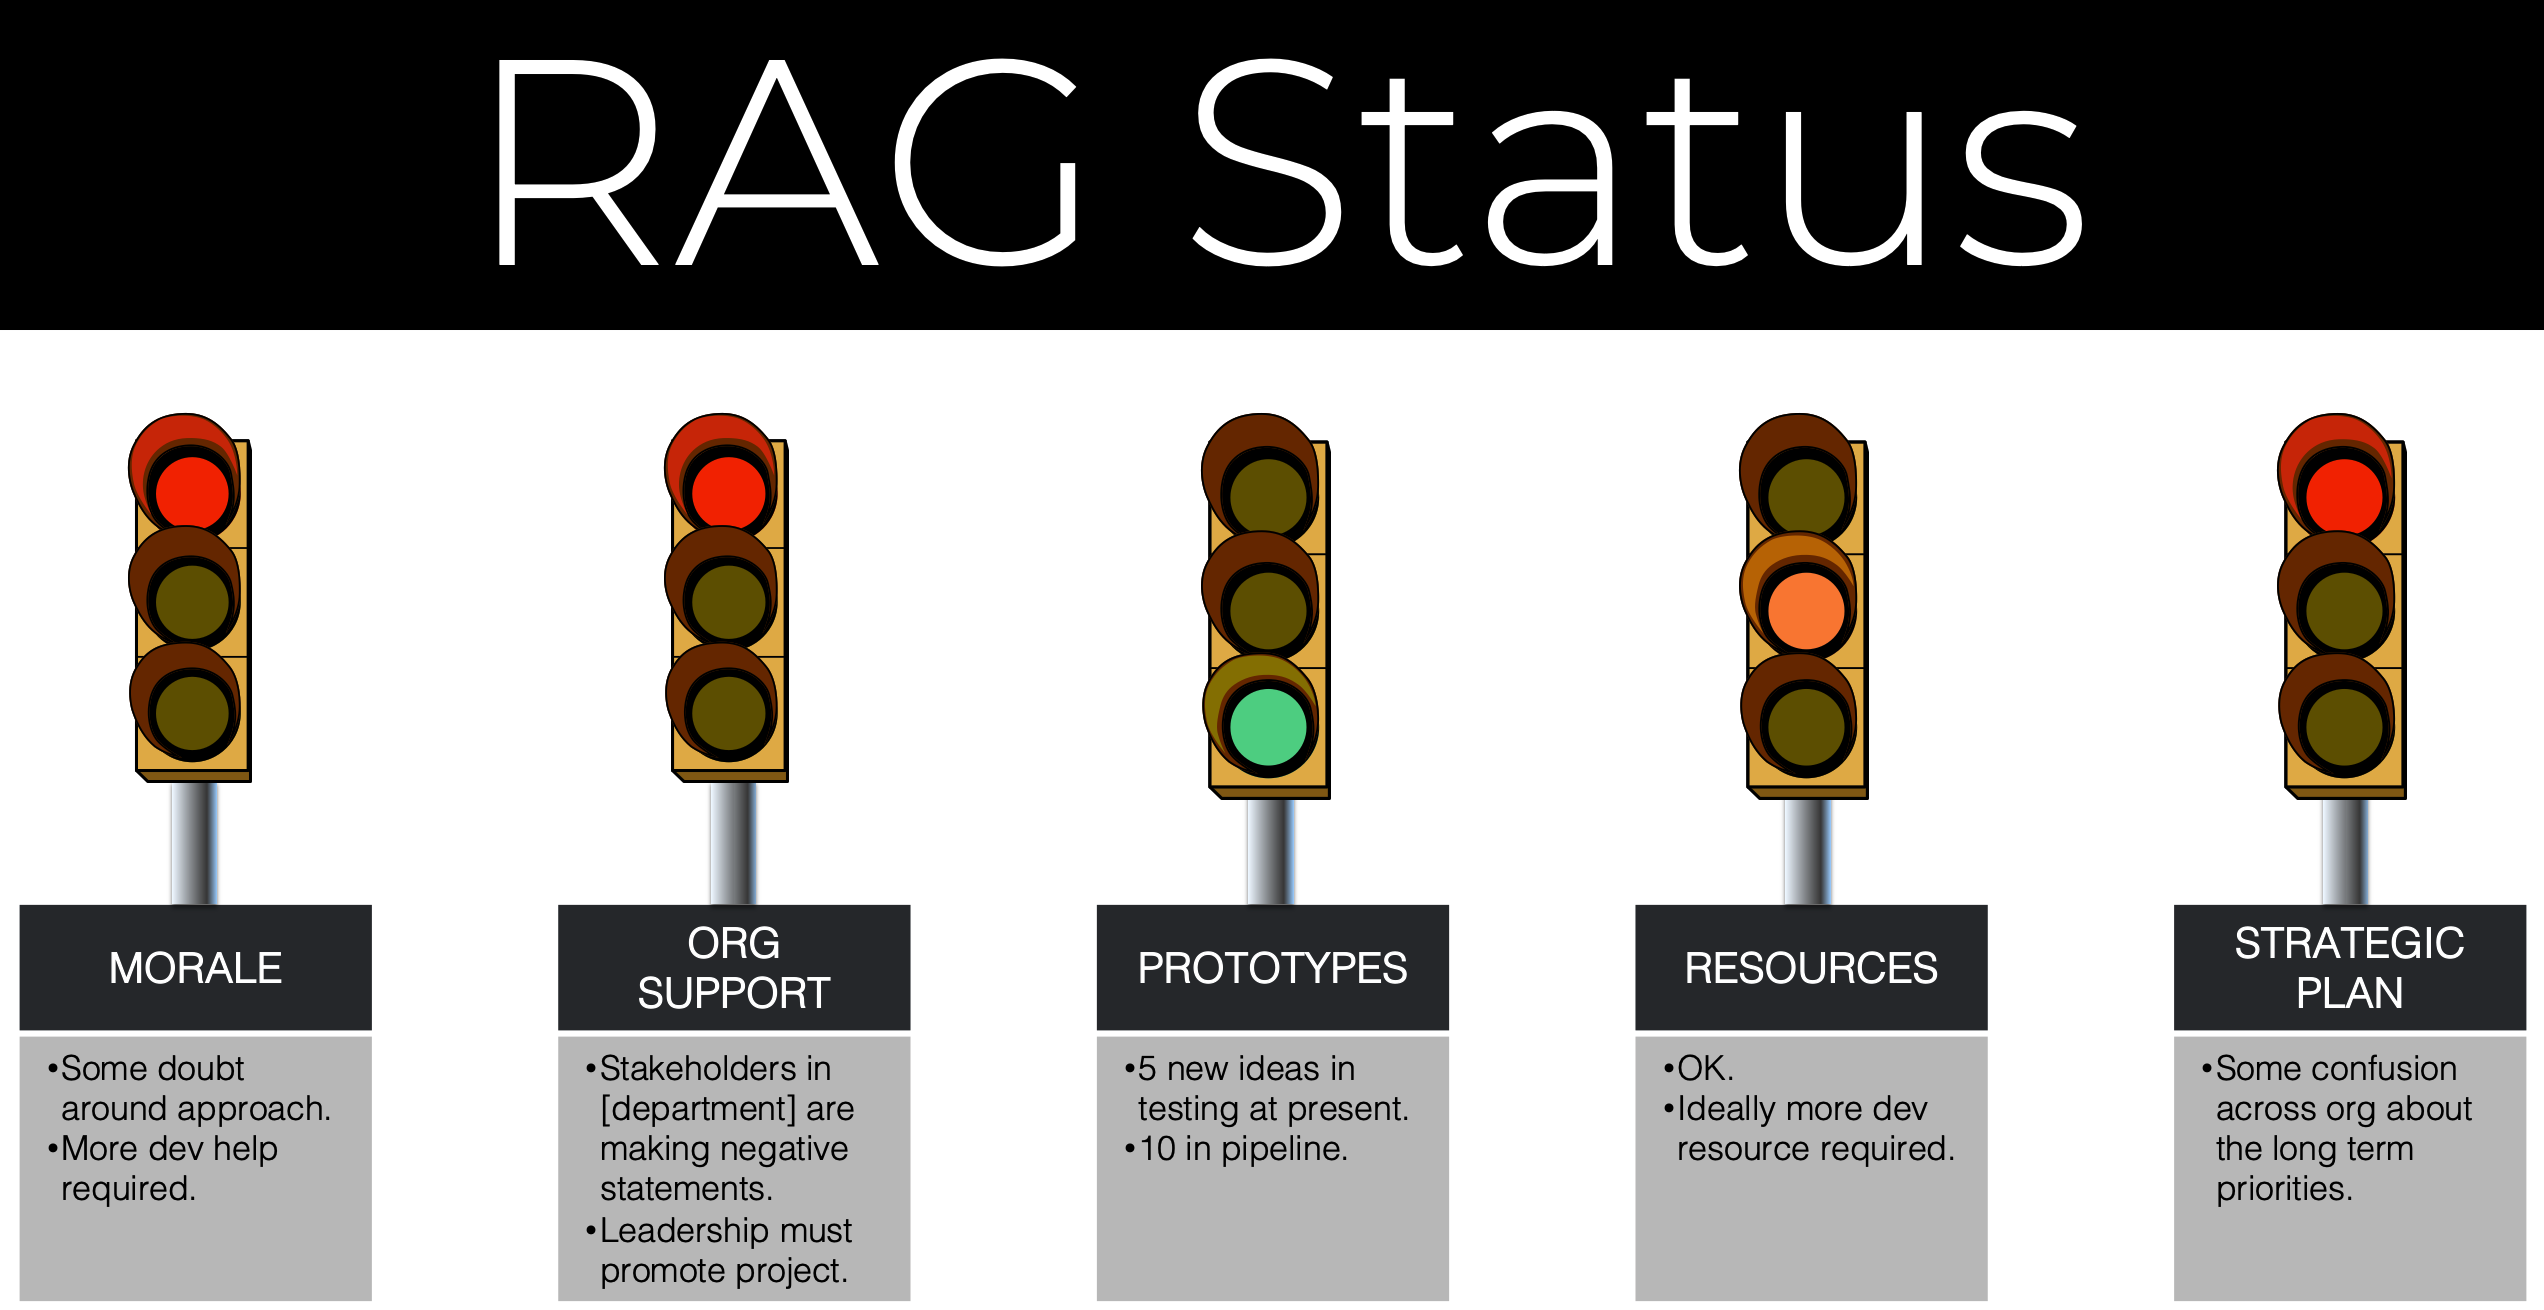
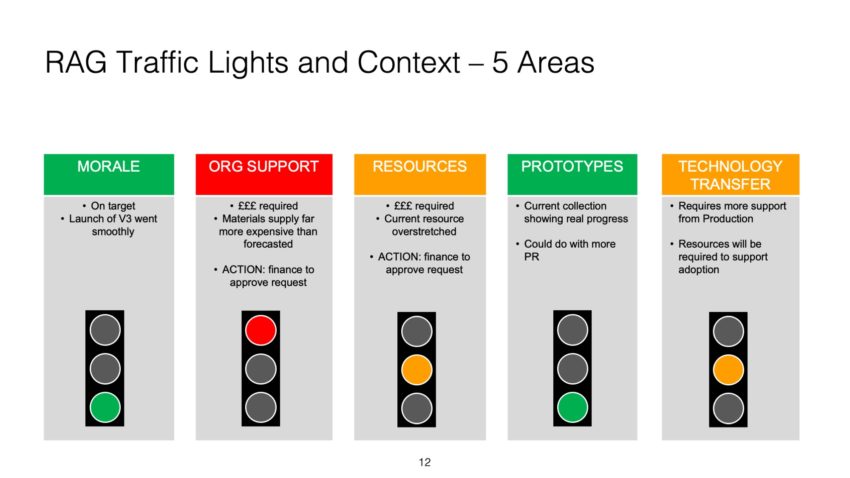
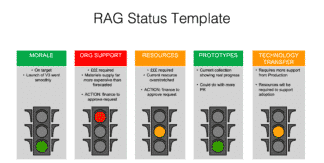
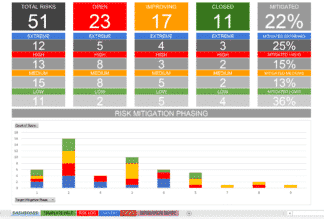
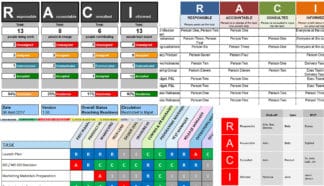
Run a High-Level RAID Log and reference your Epics
- Use a RAID log to speak in Senior Stakeholder ‘lingo’.
- Keep this light, and do not go into too much detail.
- Update each sprint, or as serious RAID changes emerge.
Leave room to manoeuvre within your Epics
- When defining your high level features or “Epics”, keep the scoping high-level.
- Be clear and strategic about the scenarios and success criteria.
- Assign risk information to your Epics – raise stakeholder awareness of which features are risky / giving issues.
- This will enable them to help you prioritise.
- In healthy organisations, this provides a diologue in which to descope and reprioritise high level features.
Include High Level “Non Functional Requirements” (NFR s)
- Be sure to include any significant NFRs.
- e.g. (and not limited to-) :
- Ingegration requirements.
- Load testing, User testing, Stakeholder Acceptance testing requirements.
- Performance testing.
- contingency for all of the above.
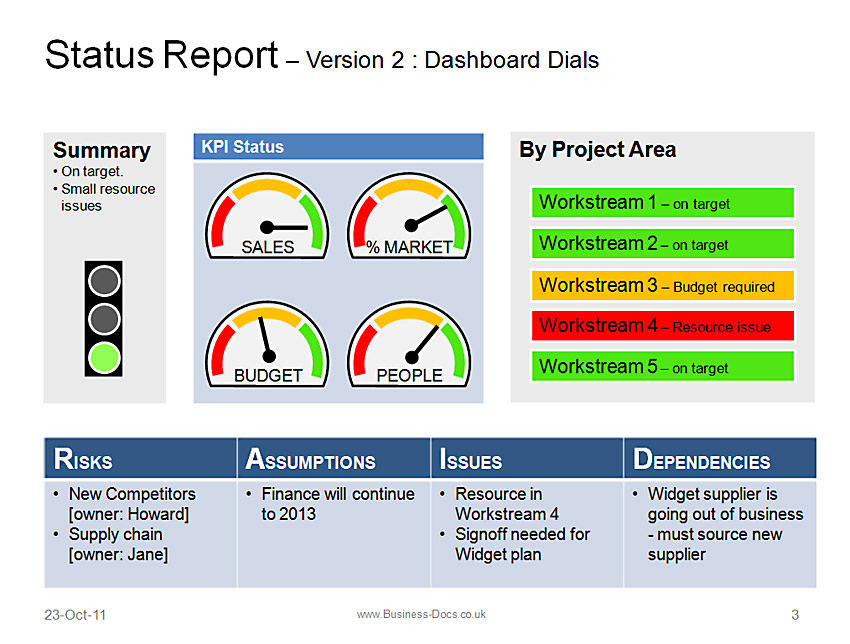
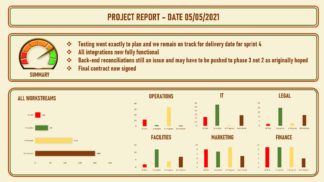
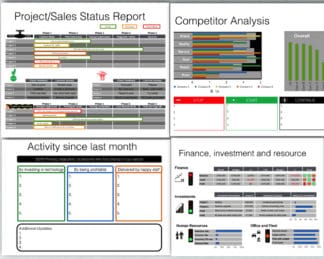
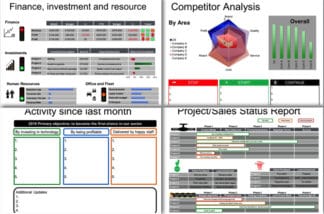
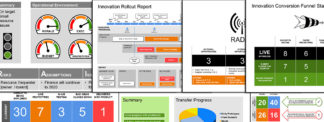
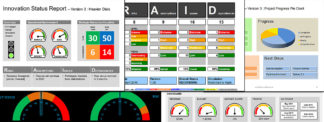
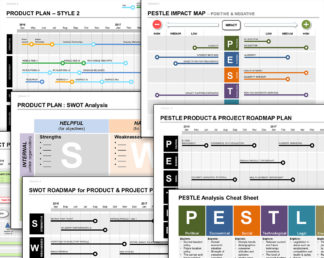
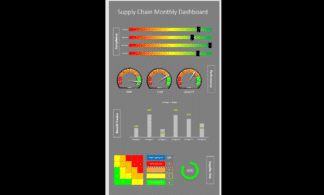
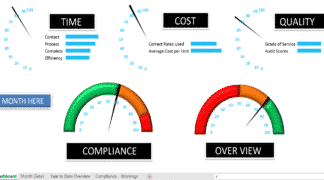
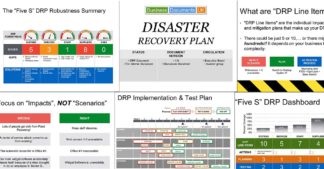
Communicate Agile Plans to Senior Stakeholders
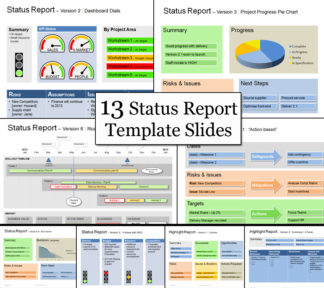
Here are some reporting formats that you can use to communicate Agile plans to Senior Stakeholders:

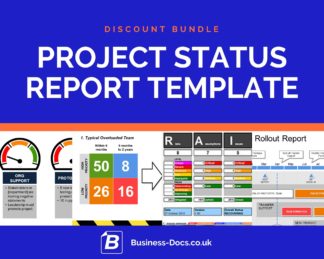
The Agile Release Planning Template Discount Bundle
$ 31.24
Add to cart

Agile Burn-Down and Burn-Up Template Excel
$ 15.99
Add to cart
MoSCoW Analysis
$ 9.93
Add to cart
Project Handover PowerPoint
$ 24.99
Add to cart
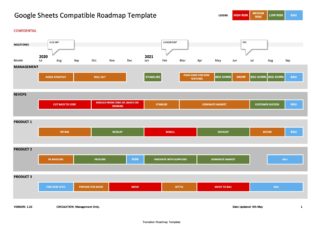
Google Sheets Compatible Roadmap Template (Excel)
$ 13.03
Add to cart
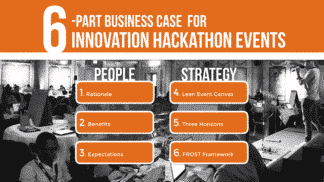
Hackathon Business Case Guide & Template (PPT and Keynote)
$ 45.99
Add to cart